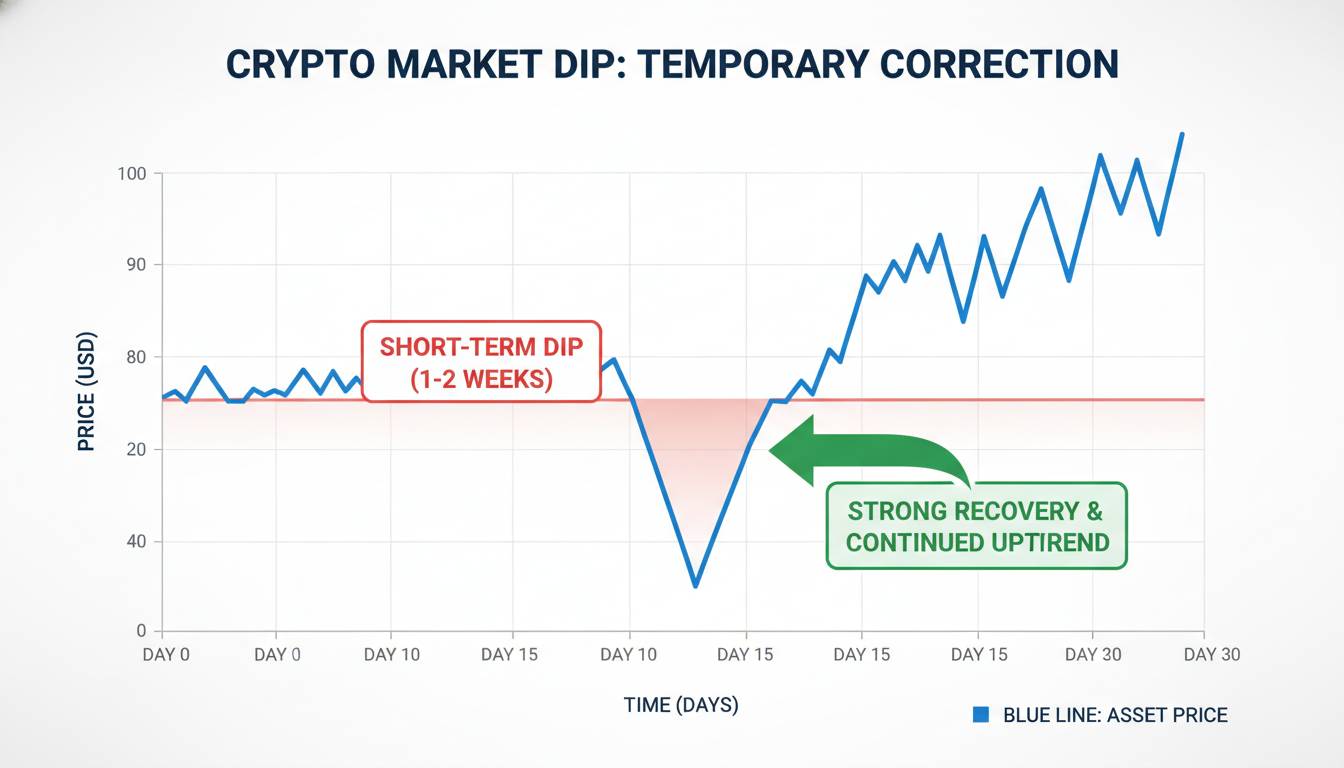
Every time Bitcoin plunges 10% in a single day, the same questions flood Google: Why did Bitcoin drop? Is this the crash? Should I sell? The search volume spikes tell a clear story—thousands of people are looking for immediate answers during moments of market panic. But here’s what most of those articles miss: they explain what happened in the past tense without giving you the tools to understand what happens next.
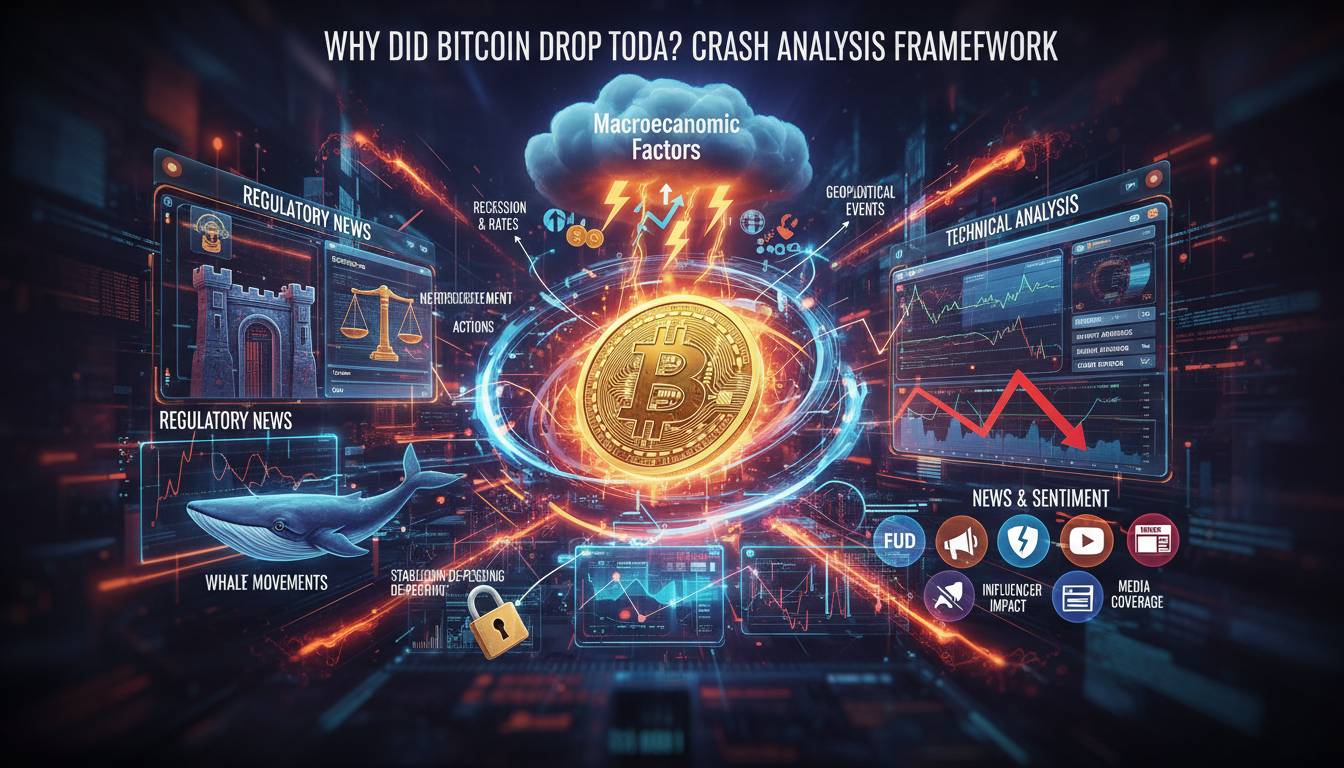
This framework changes that. Rather than offering a one-time explanation for today’s drop, I’m breaking down the ten factors that drive virtually every Bitcoin crash. Some of them are obvious. Others contradict the conventional wisdom you’ll read on crypto Twitter. By the end, you’ll have a mental checklist you can apply to any crash—not just today’s headlines, but the next one and the one after that.
One honest admission before we dive in: I cannot predict crashes. Nobody can predict them consistently. What I can do is explain the mechanics that create the conditions for crashes, so you can recognize those conditions in real time and make more informed decisions instead of panic-selling or FOMO-buying.
1. Macro Market Correlation and Global Liquidity Cycles
Bitcoin doesn’t trade in a vacuum. Since roughly 2017, Bitcoin has demonstrated a measurable correlation with the S&P 500, particularly during periods of market stress. When the Federal Reserve signals tightening, when Treasury yields spike, when global liquidity contracts—Bitcoin tends to follow.
The March 2020 crash proved this conclusively. When the Fed panic-sold assets and markets froze, Bitcoin dropped 50% in 48 hours alongside equities. The correlation wasn’t a coincidence. Large institutional players who hold both Bitcoin and stocks rebalanced their portfolios during the crisis, selling Bitcoin to cover margin calls elsewhere.
More recently, the 2022 bear market coincided with the Fed’s aggressive rate hike cycle. Bitcoin fell from $69,000 to $16,000—not because of anything specific to the Bitcoin network, but because global liquidity dried up. When money becomes expensive to borrow, speculative assets suffer first.
Check the VIX, Treasury yields, and Fed policy statements before assuming a Bitcoin drop is “crypto-native.” If global markets are bleeding, Bitcoin will likely bleed with them.
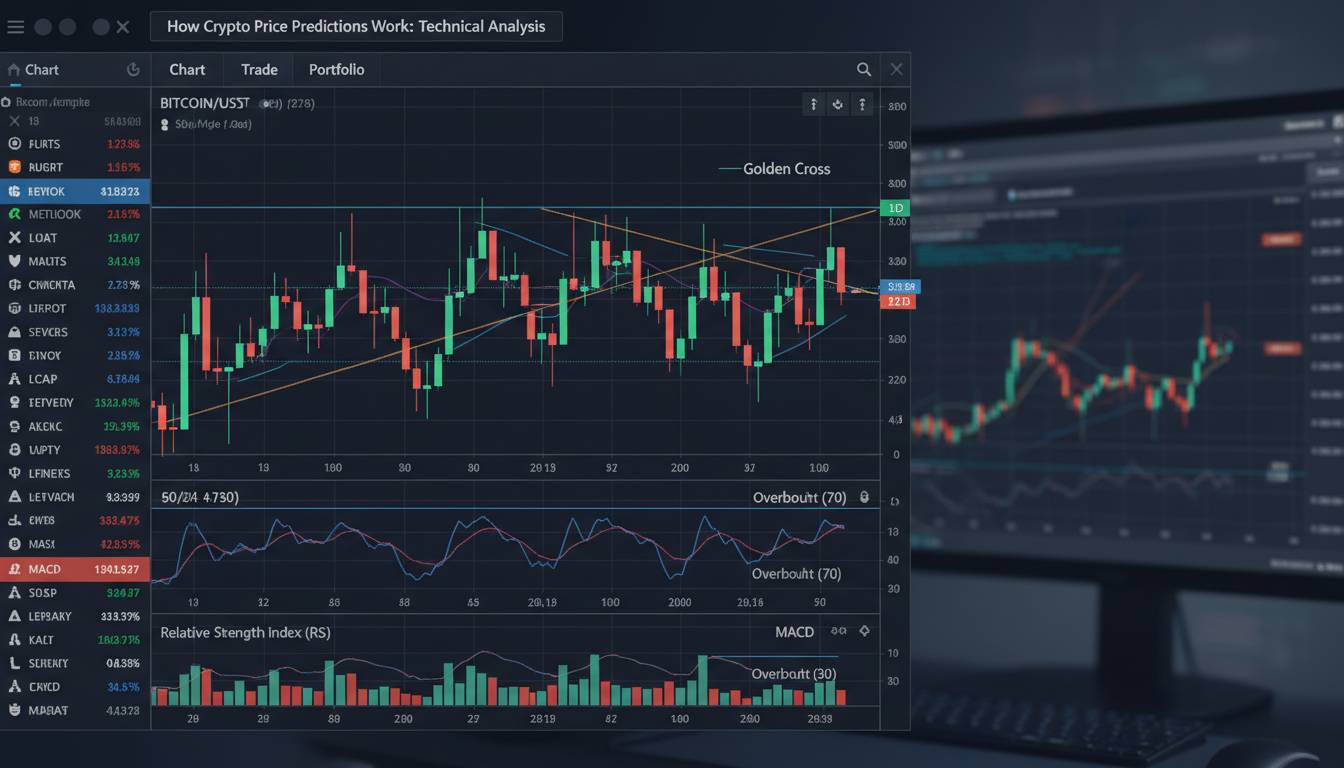
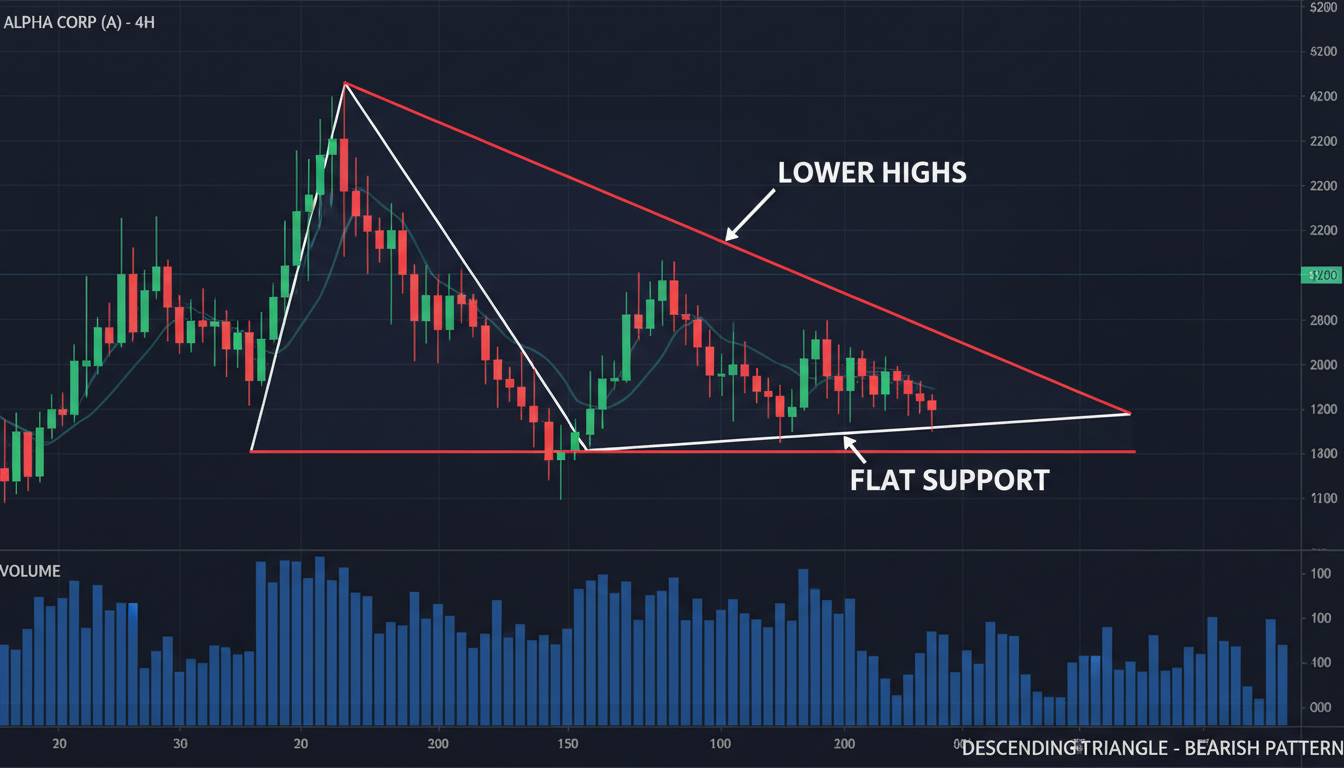
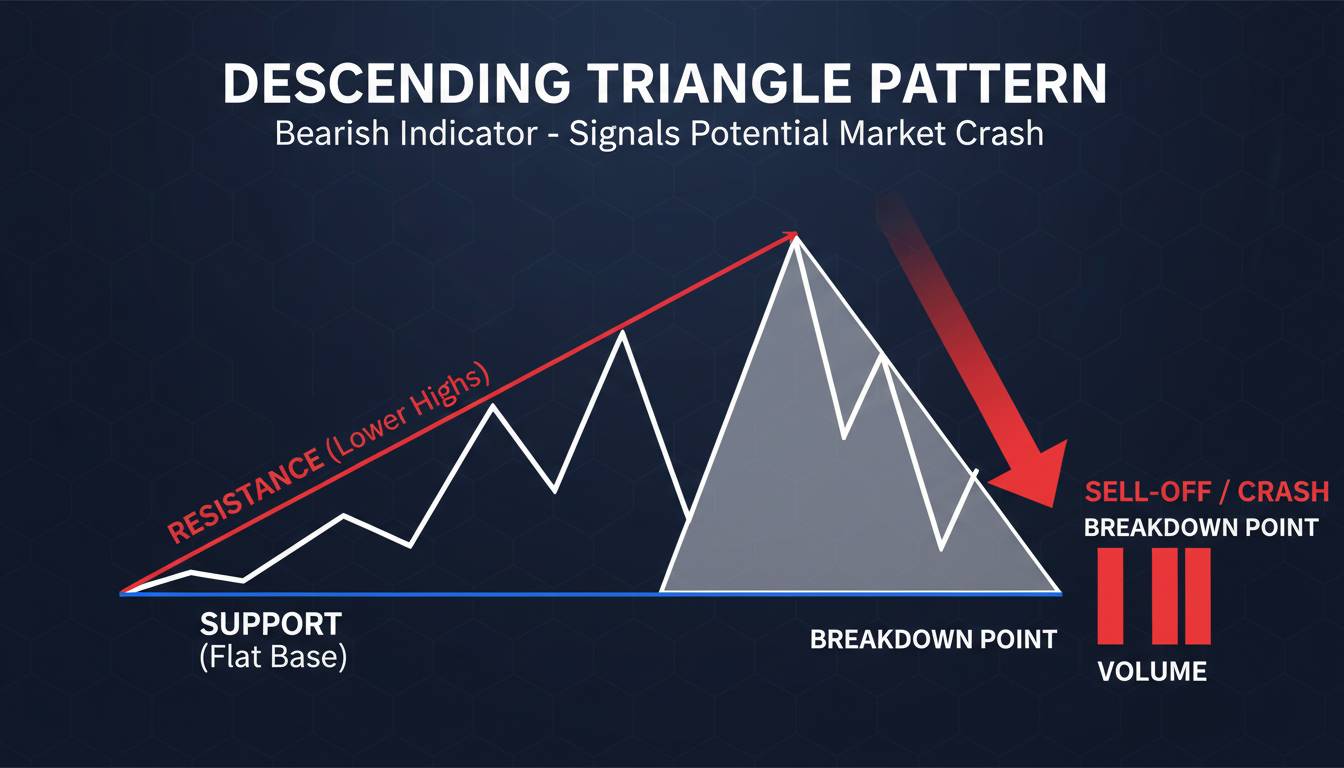
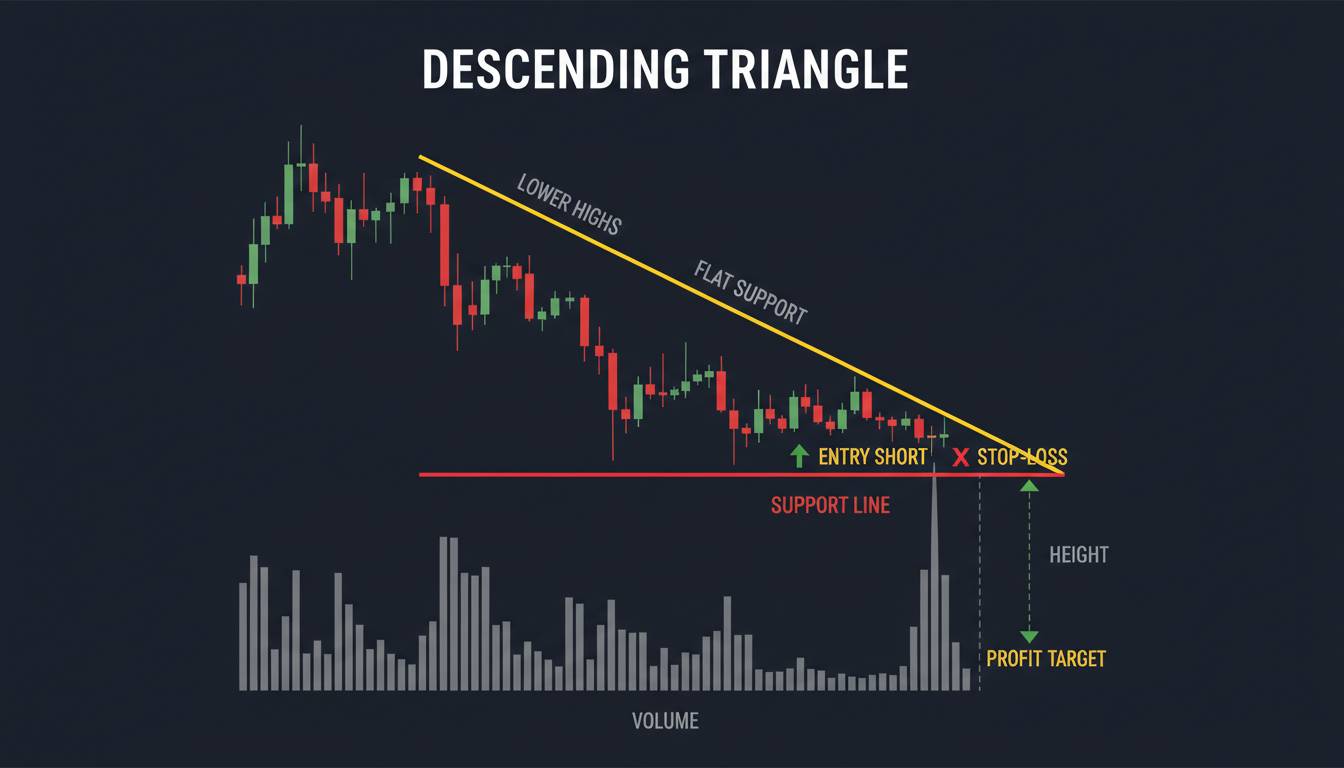
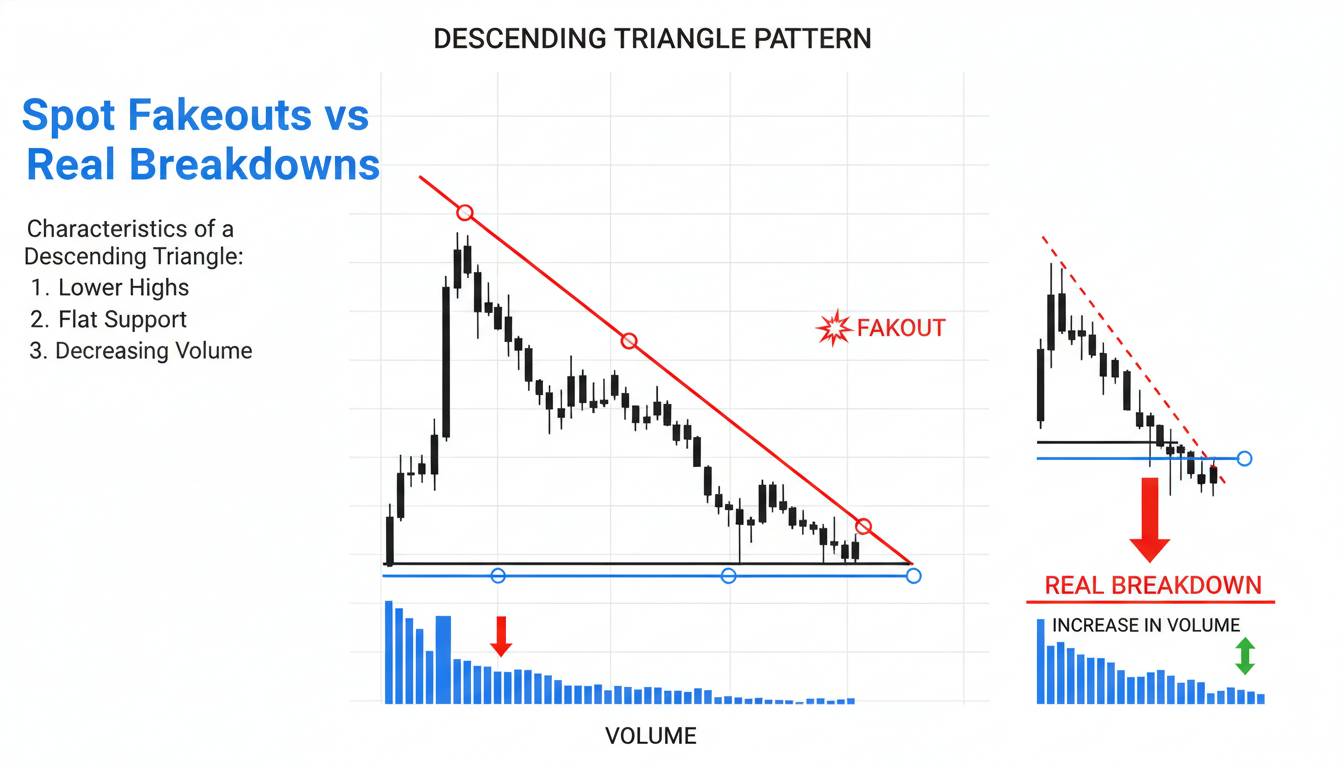
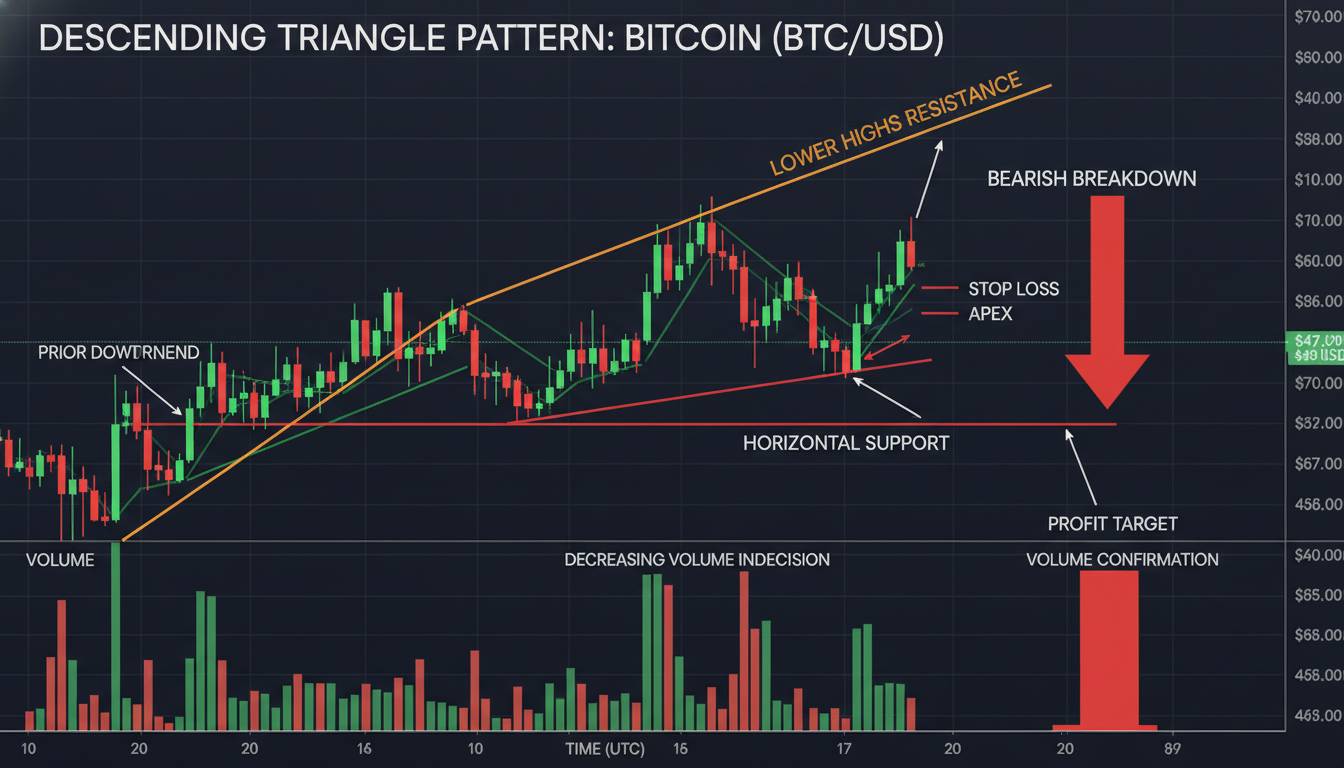
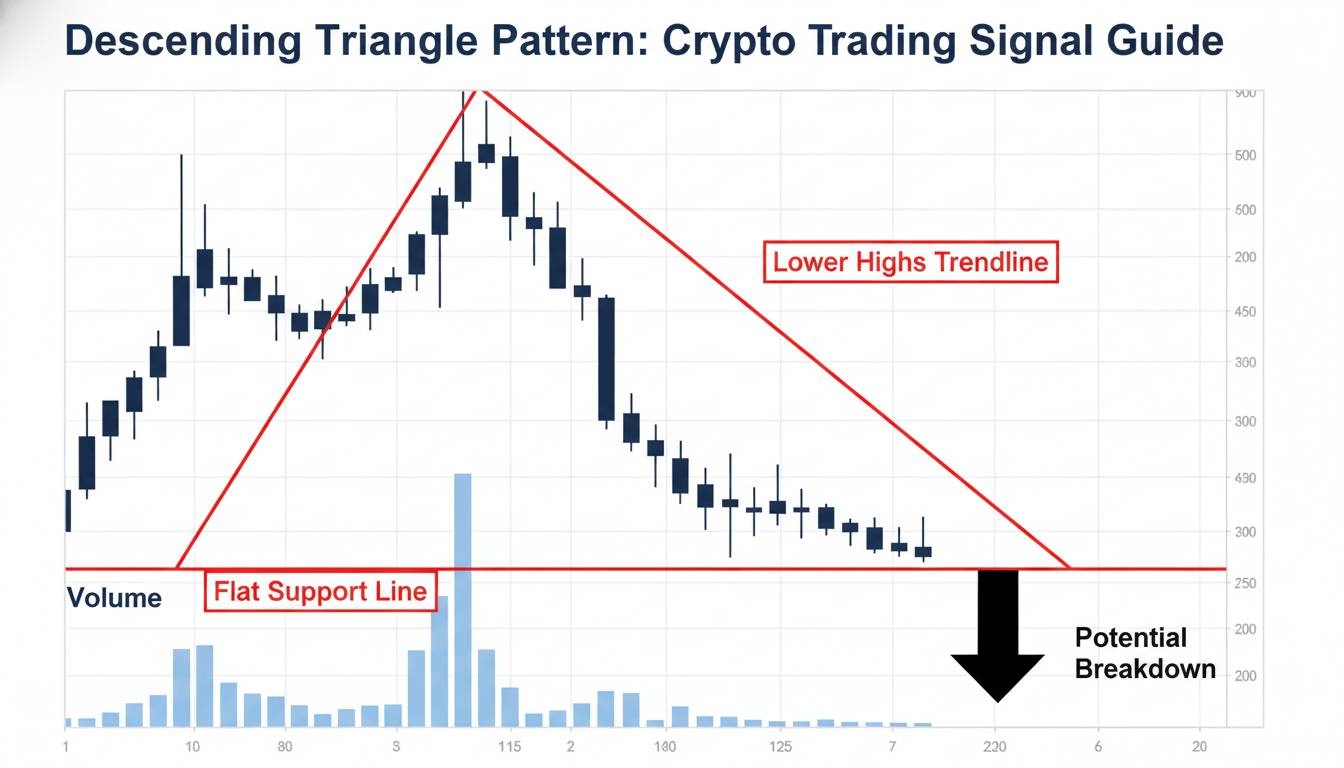
2. Technical Support and Resistance Breakdown
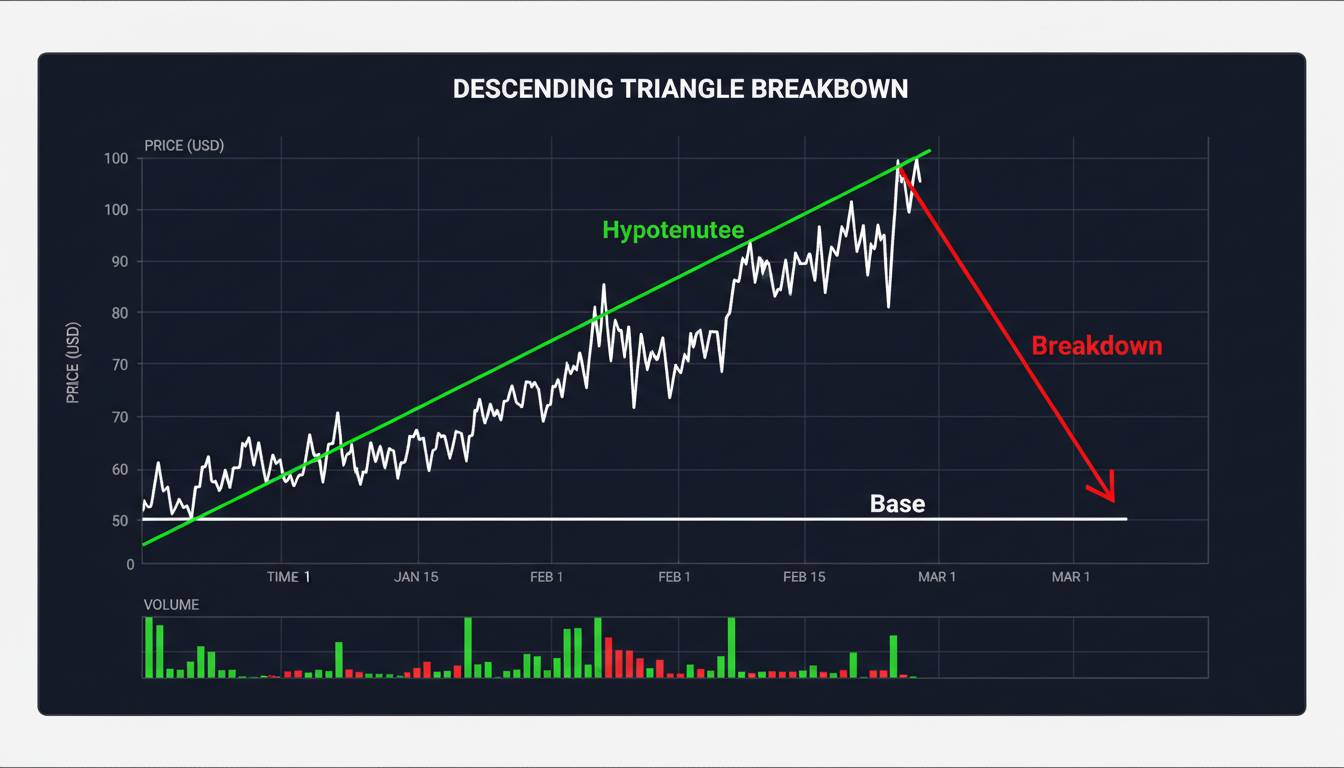
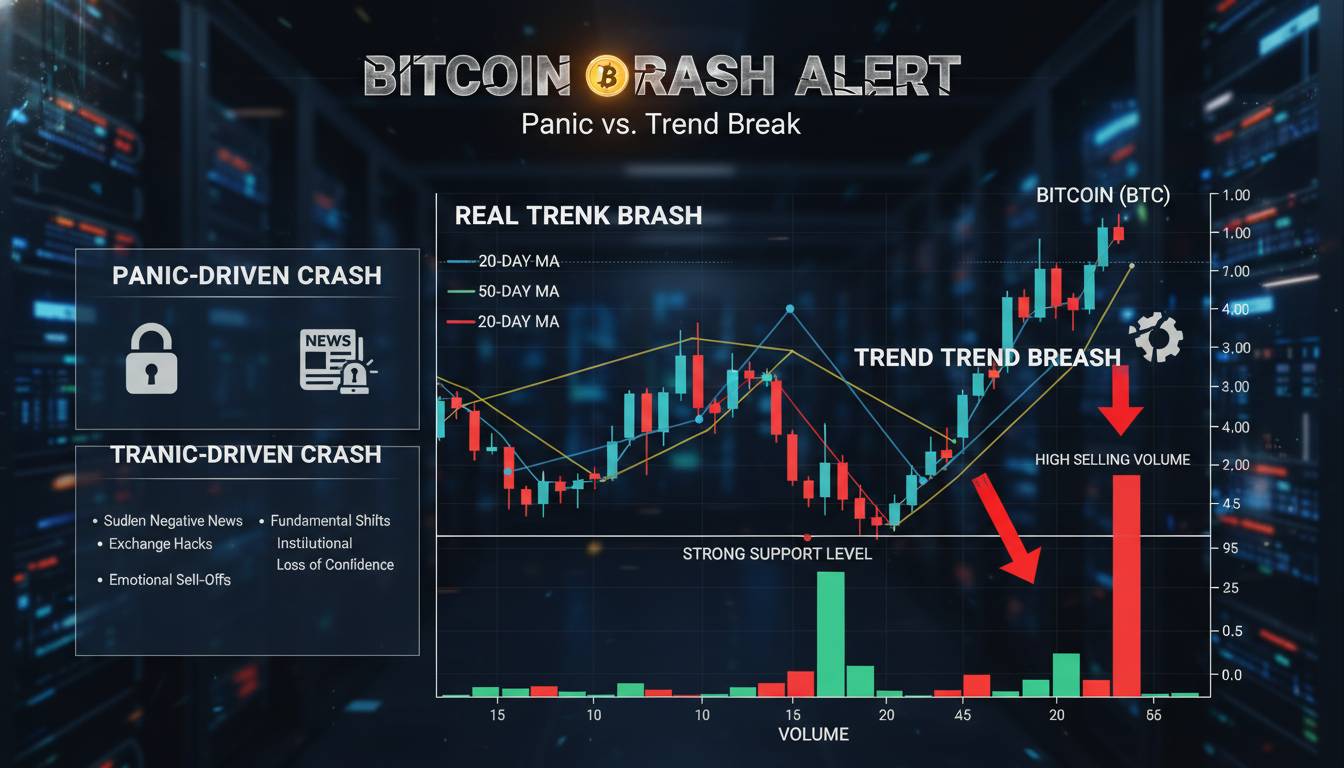
Charts matter, even if you’re not a full-time trader. When Bitcoin breaks below a well-established support level, it triggers automated selling from algorithmic traders and cascades of stop-loss orders.
The $20,000 level is the clearest recent example. Bitcoin held above $20,000 for most of 2020 and 2021. When it finally broke below in November 2022, it wasn’t just a number—it was a psychological and technical threshold that had accumulated years of buying history. Once that support broke, it became resistance, and the price continued its descent toward the $16,000 range.
Key technical levels to watch:
- Previous cycle all-time highs (now support in bear markets)
- The 200-week moving average, which has historically marked cycle bottoms
- Fibonacci retracement levels from recent highs
The limitation here: technical analysis is self-fulfilling to a degree. When enough traders watch the same level, their collective behavior creates the break or bounce. It’s not magic—it’s market psychology made visible on a chart.
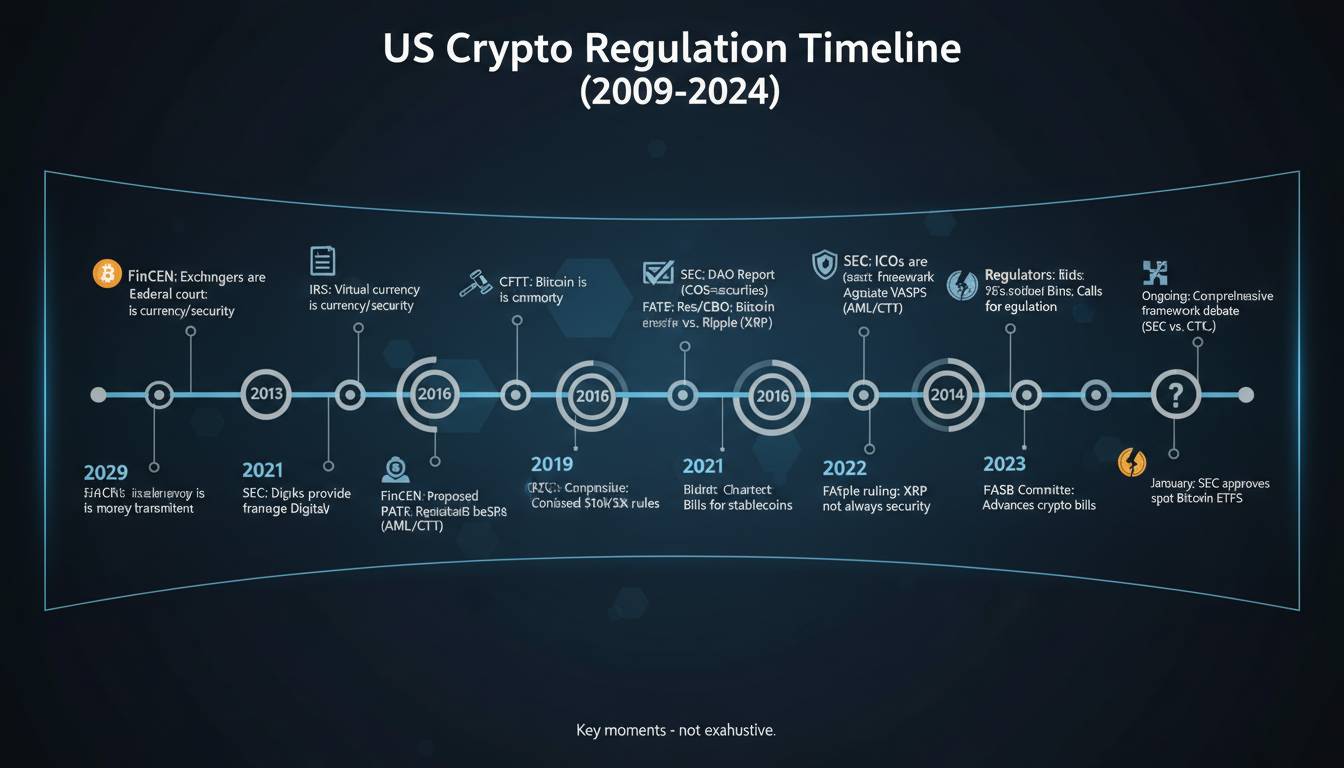
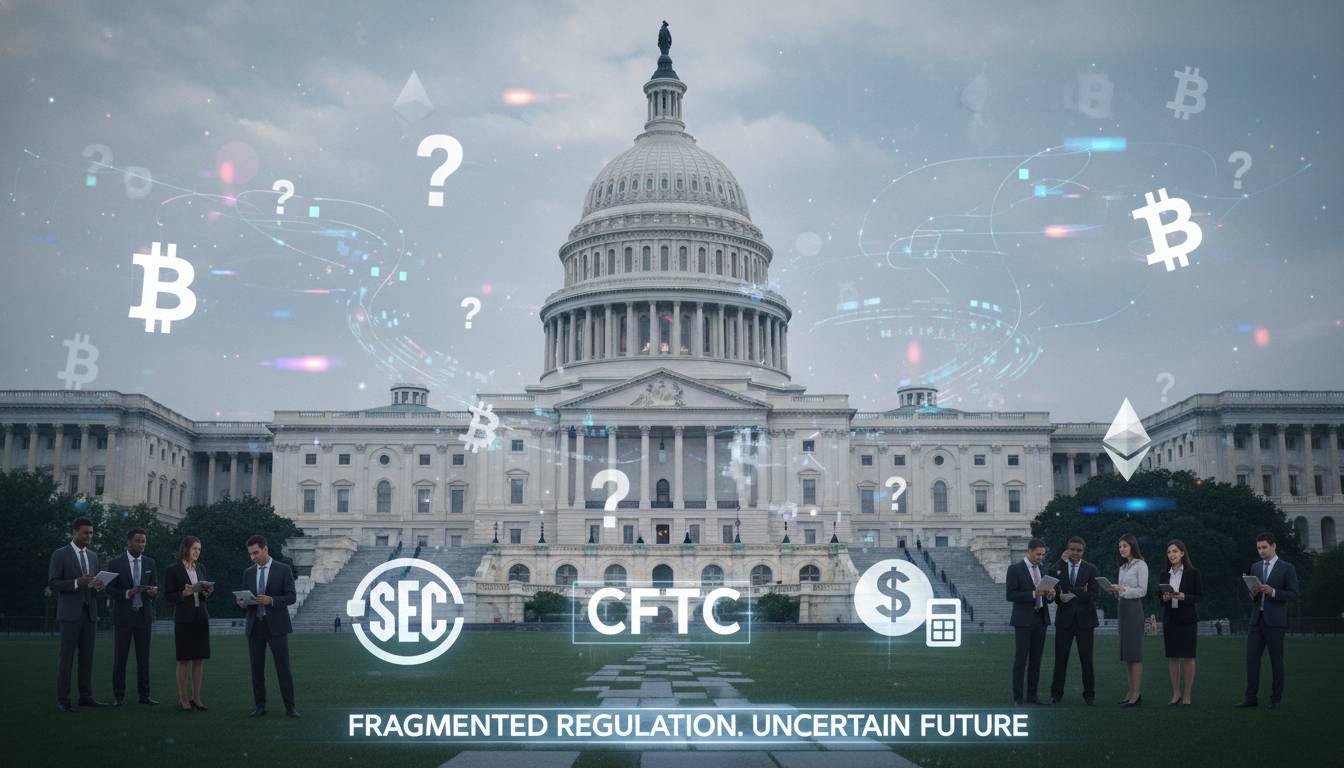
3. Regulatory Announcements and Enforcement Actions
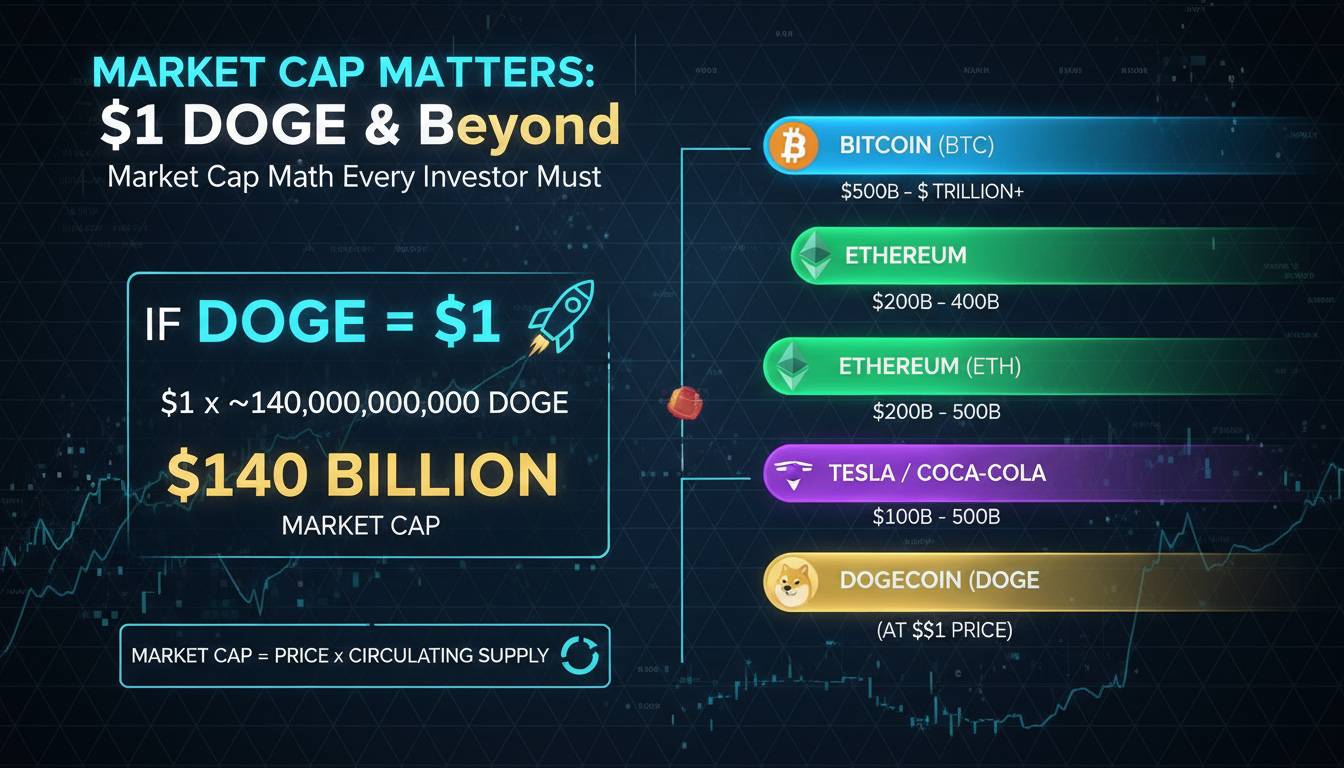
Regulatory news can move Bitcoin faster than almost any other factor. A single announcement from the SEC, a comment from a Treasury official, or a ban in a major economy can erase billions in market cap within hours.
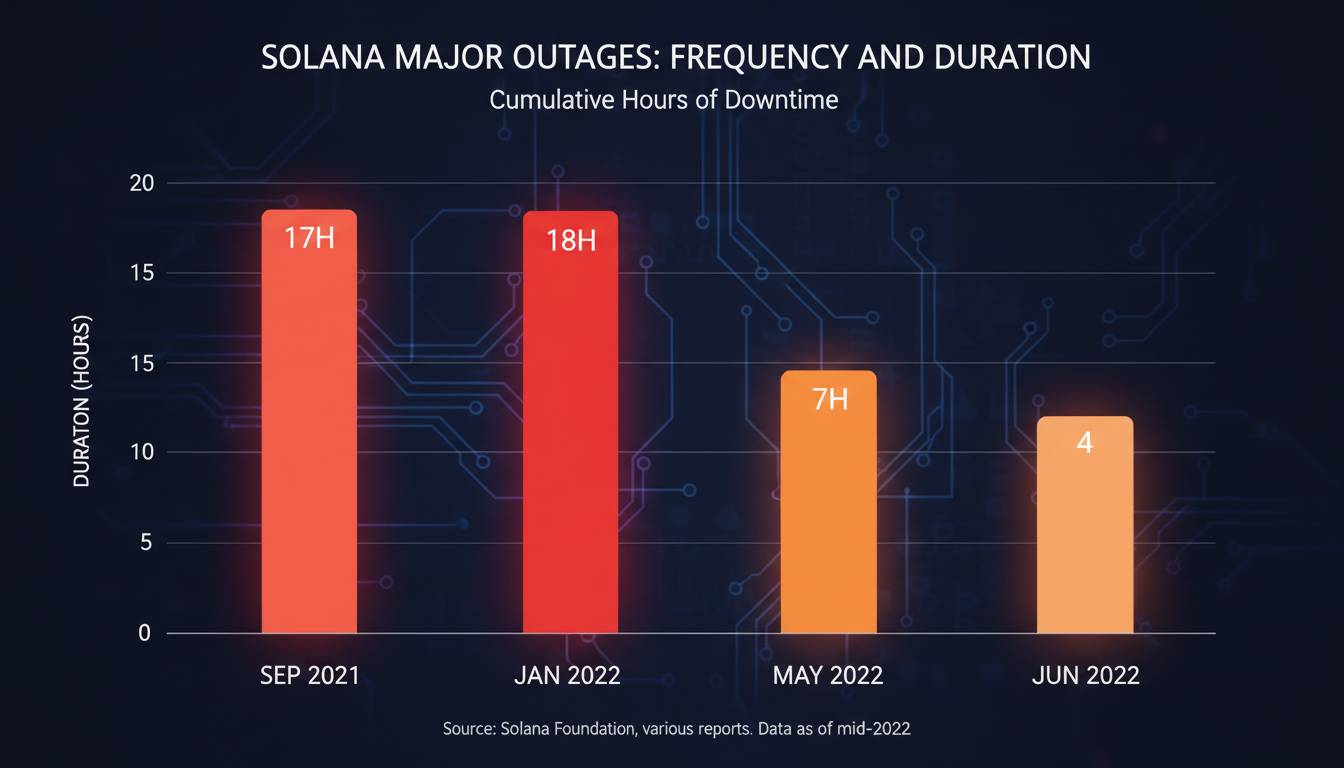
The China mining ban of 2021 illustrates this perfectly. In May 2021, China cracked down on cryptocurrency mining and trading. By July, Bitcoin’s hash rate—the computational power securing the network—had dropped by 50% as miners shut down operations. The price dropped from $64,000 to under $30,000 over the following months.
More recently, the SEC’s enforcement actions against Binance and Coinbase in 2023 created sustained selling pressure. These weren’t instant crashes—they were slow bleeds driven by uncertainty about which other exchanges or protocols might face legal action.
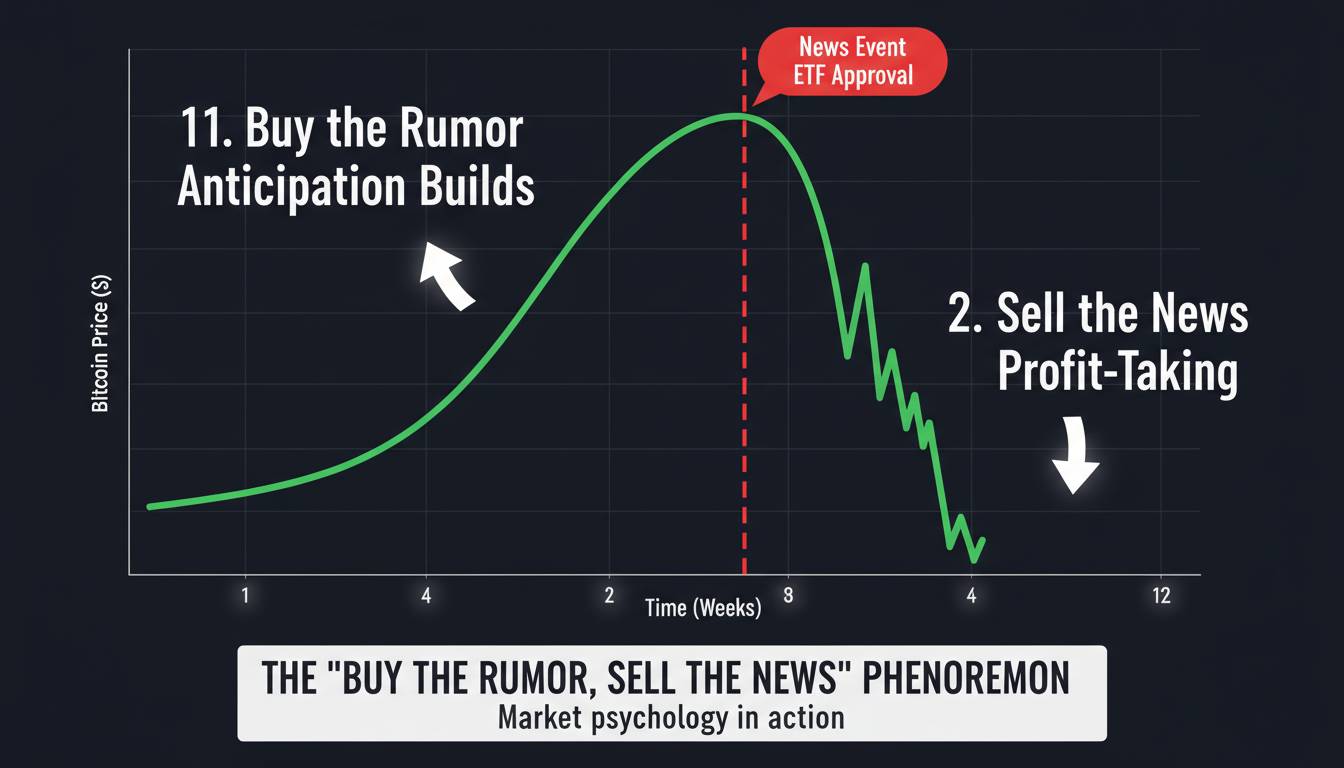
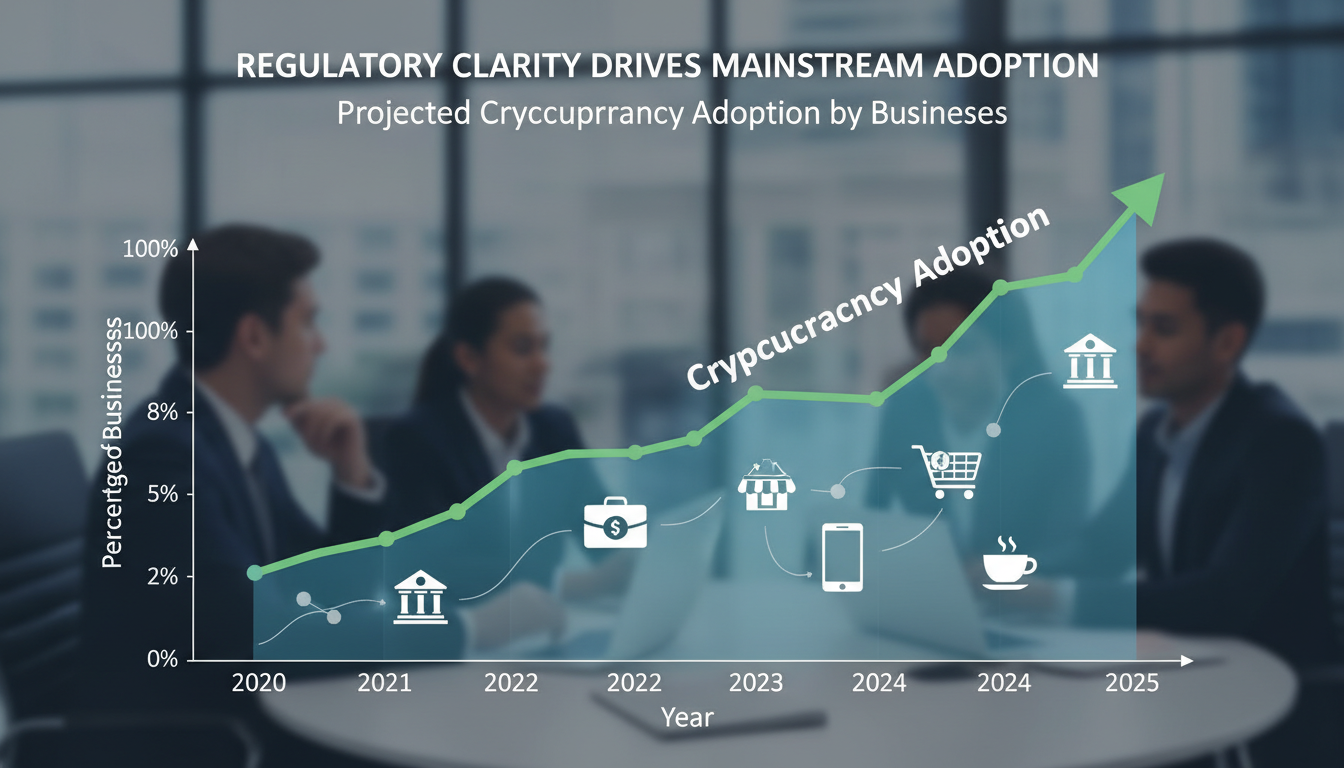
The counterintuitive reality: regulatory FUD (fear, uncertainty, and doubt) often creates better buying opportunities than fundamental news. The initial panic sell-off is usually overblown, and Bitcoin has a history of recovering from regulatory attacks. However, prolonged regulatory uncertainty—which is what we’re dealing with now—can suppress prices for months or years.
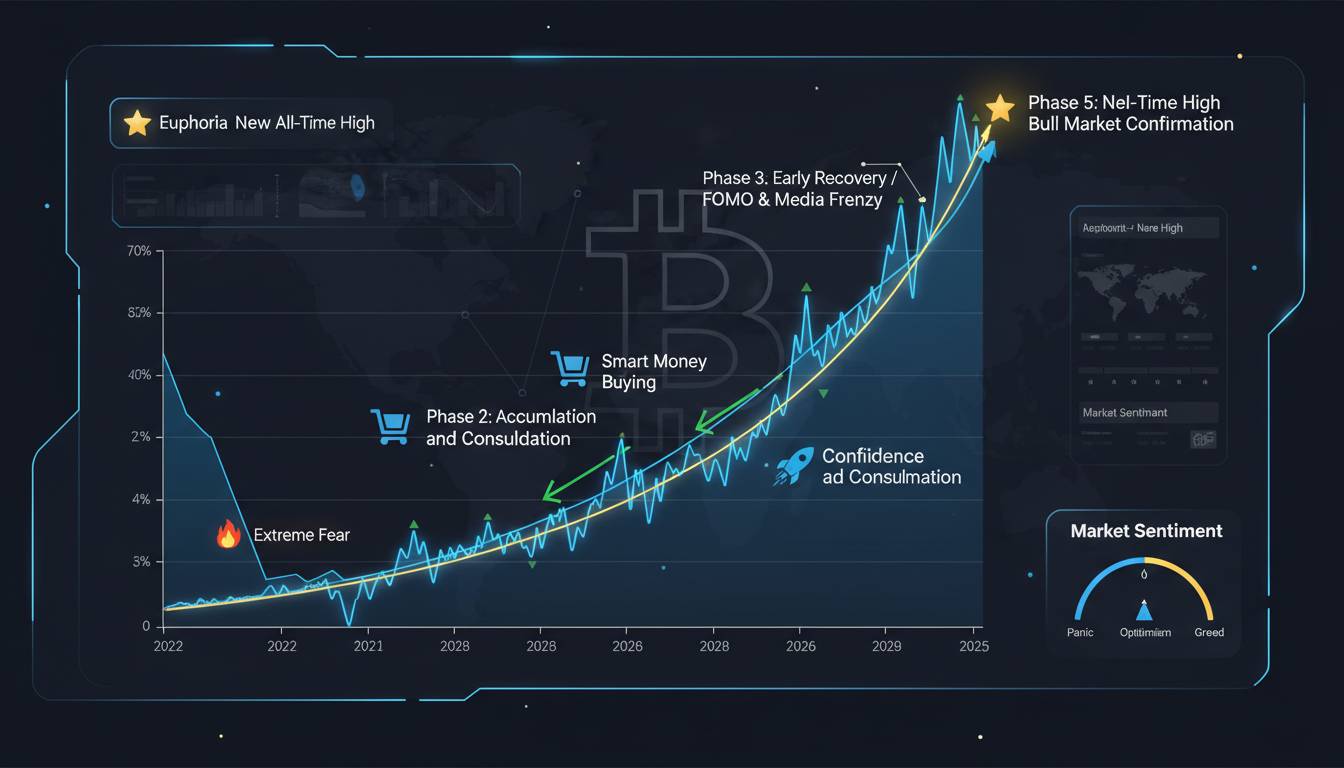
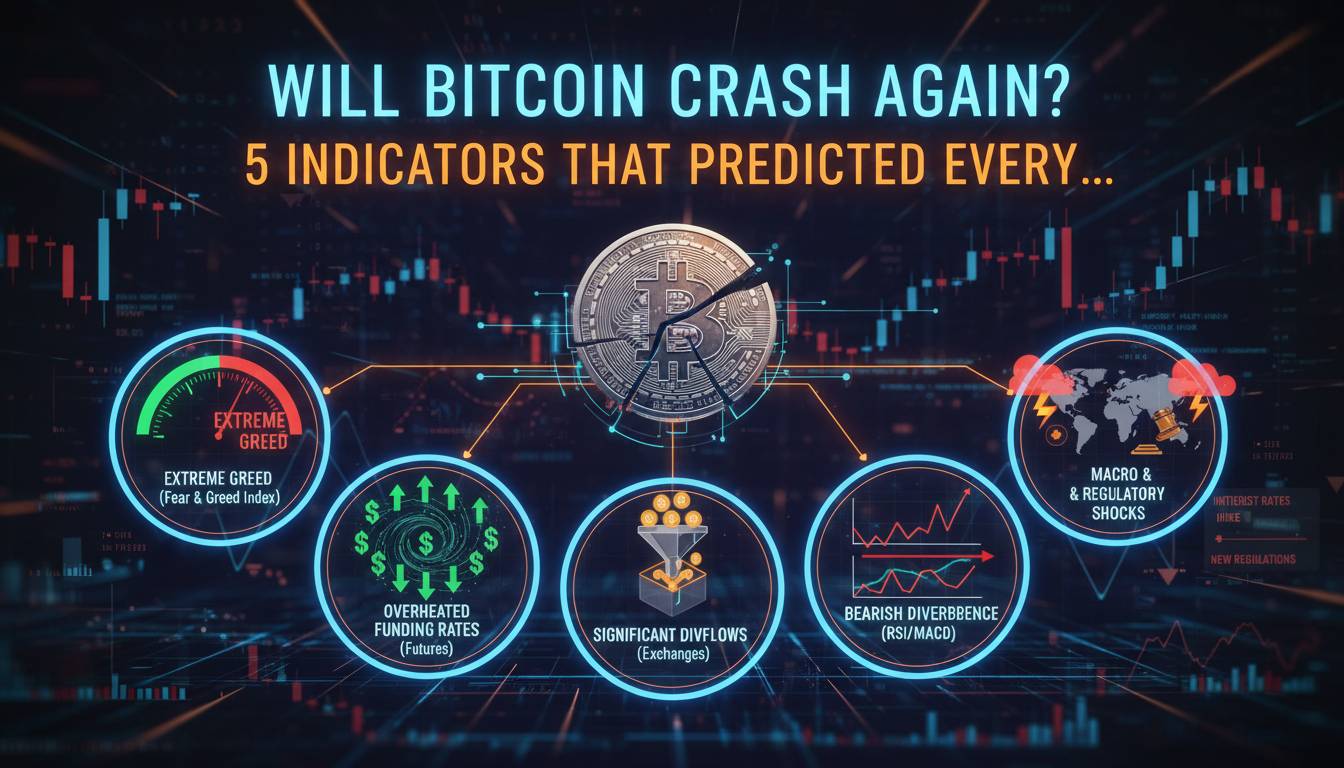
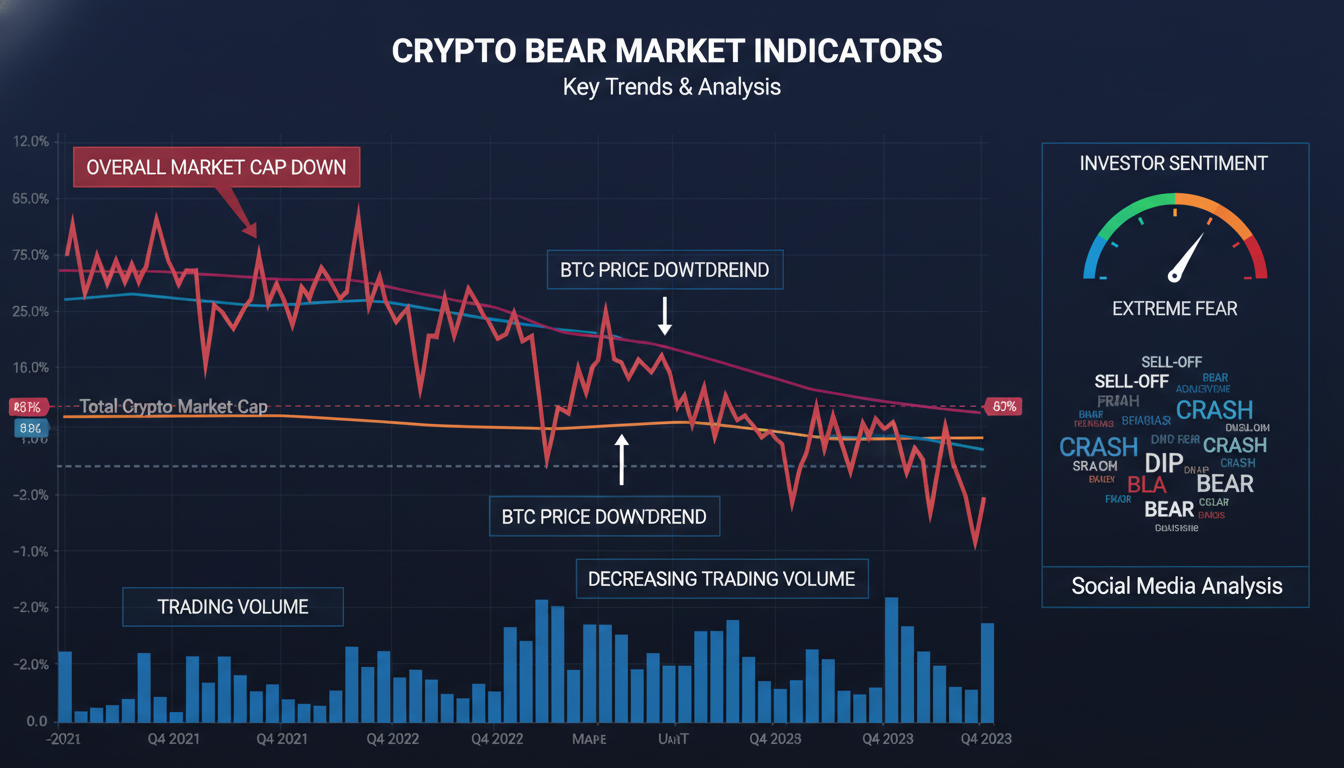
4. Sentiment Indicators and the Fear Index
Market sentiment is a contrarian indicator at its core. When everyone is euphoric, a top is near. When everyone is terrified, a bottom is often close.
The Crypto Fear & Greed Index aggregates seven different data points—volatility, market momentum, social media volume, surveys, Bitcoin’s dominance, and search trends—to produce a daily score from 0 (Extreme Fear) to 100 (Extreme Greed). Historically, values below 20 have coincided with cycle bottoms, while values above 75 have marked local tops.
During the May 2021 crash (the “UFO crash” that wiped out $300 billion in days), the Fear Index hit 10—deep in extreme fear territory. The subsequent bounce was violent. Similarly, during the FTX collapse in November 2022, the index plummeted to 12 before the market began its recovery.
The key insight: extreme fear doesn’t mean the crash is over, but it does mean the risk-reward ratio has shifted meaningfully in favor of buyers. Conversely, greed—expressed through high leverage, unreasonable optimism, and social media hype—typically precedes the most painful crashes.
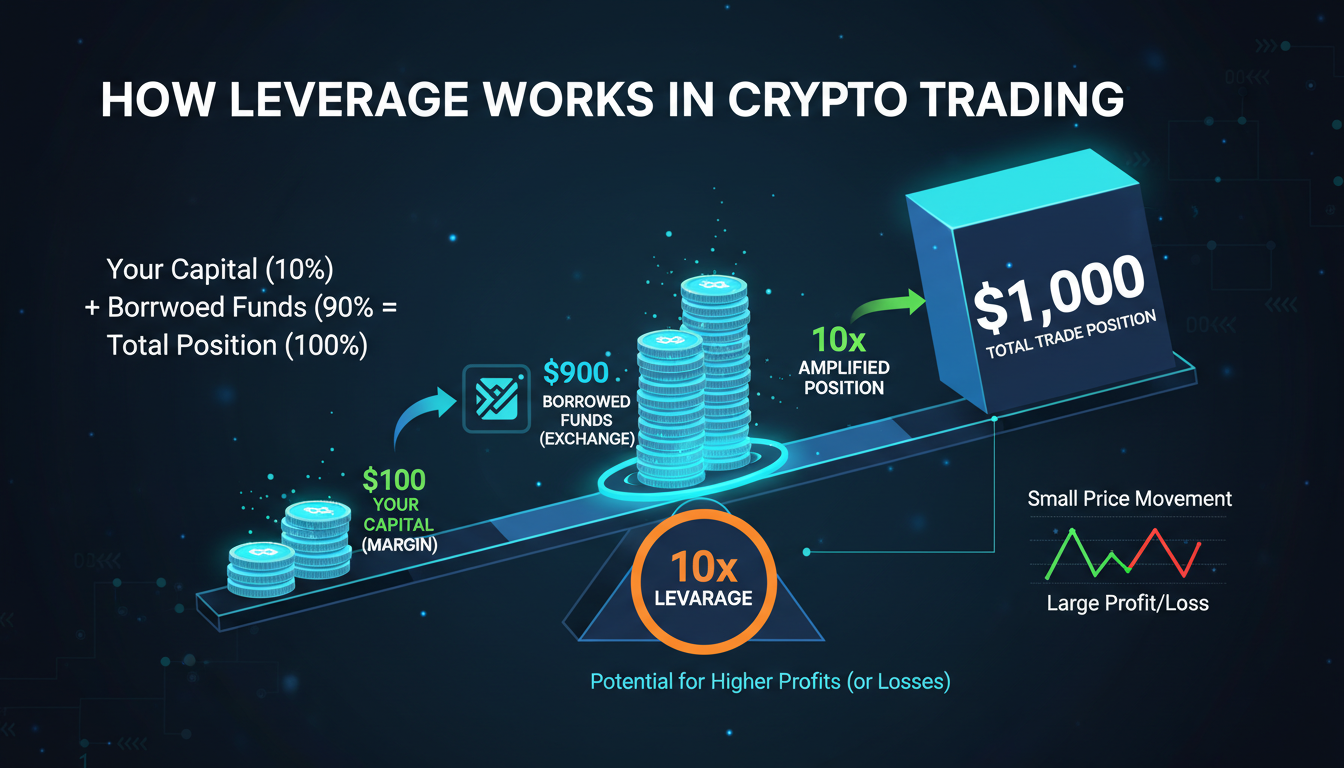
5. Leverage, Margin Calls, and Liquidation Cascades
This is where crashes become self-fulfilling. In a highly leveraged market, even a moderate price drop can trigger mass liquidations, which then push the price lower, which triggers more liquidations.
Bitcoin’s 2021 crashes were amplified by leverage. At the peak of the November 2021 bull run, aggregate leverage ratios across major exchanges exceeded 100:1 in some cases. When Bitcoin dropped 8% in a single hour in November 2021, over $3 billion in long positions were liquidated within 24 hours. The cascade effect turned what might have been a 5% pullback into a 20% crash.
The April 2023 drop from $31,000 to $28,000 in a single day followed a similar pattern. High open interest on perpetual futures contracts meant that any sudden price movement would squeeze overleveraged long positions.
If you hold leveraged positions during a crash, you don’t get to decide when to exit. The market decides for you through forced liquidations. If you’re serious about surviving crashes, reduce leverage or exit entirely before volatility spikes.
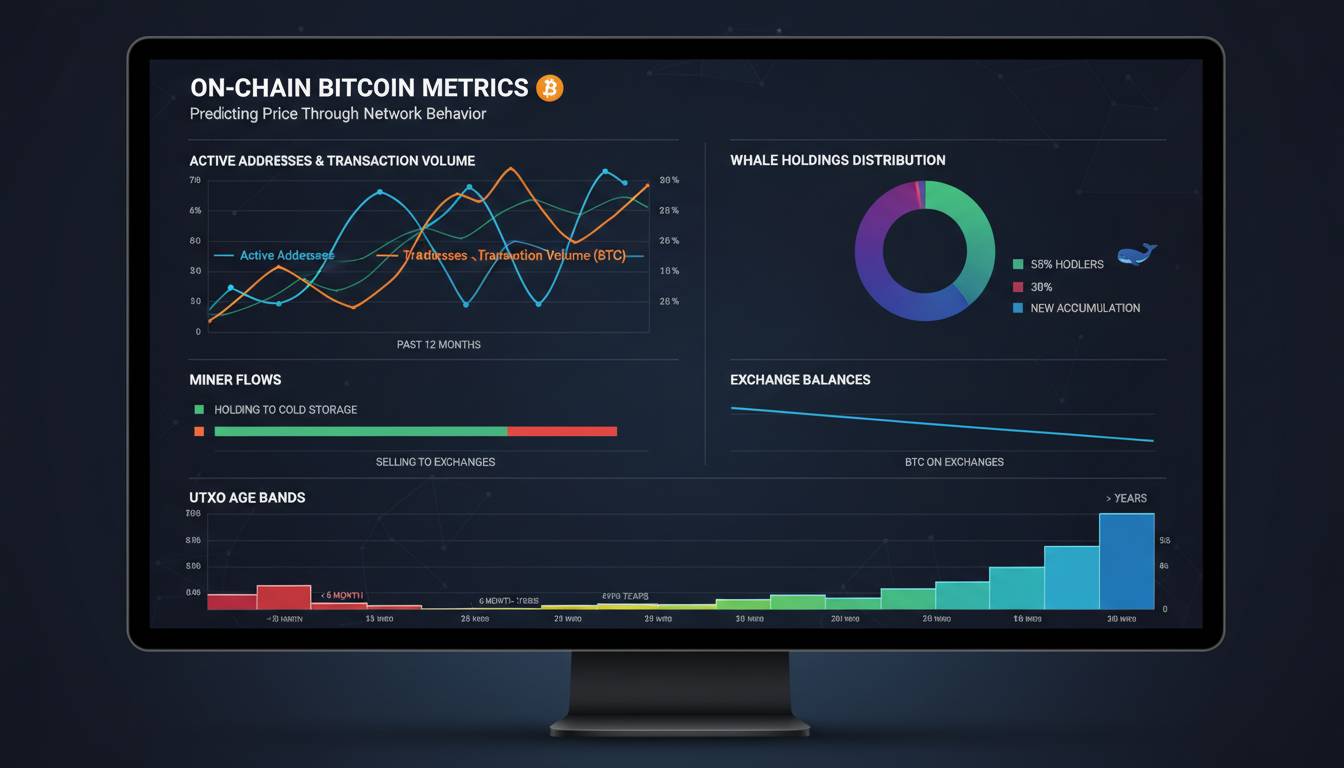
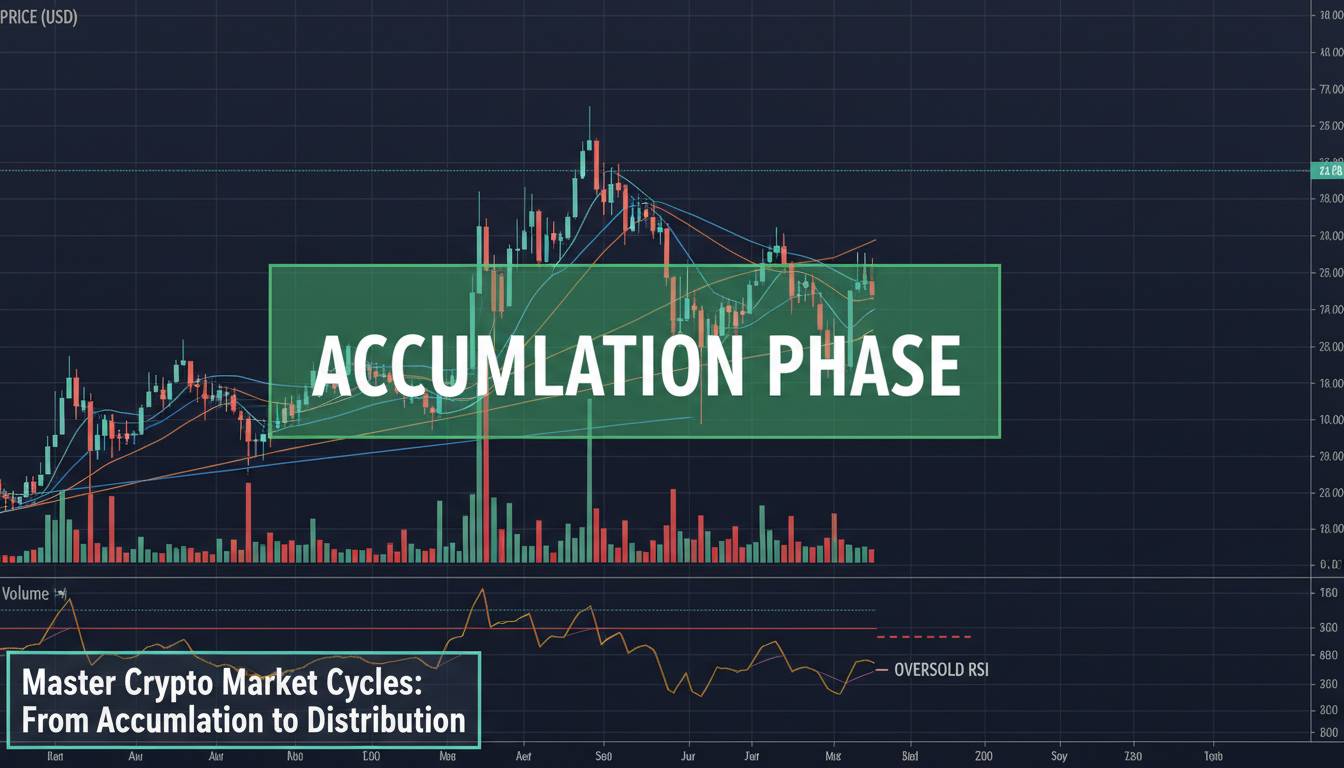
6. On-Chain Metrics and Exchange Flows
On-chain data provides a window into what large-scale holders are actually doing. While price is backward-looking, on-chain metrics can sometimes signal accumulation or distribution before it shows up in the charts.
Three metrics matter most during crashes:
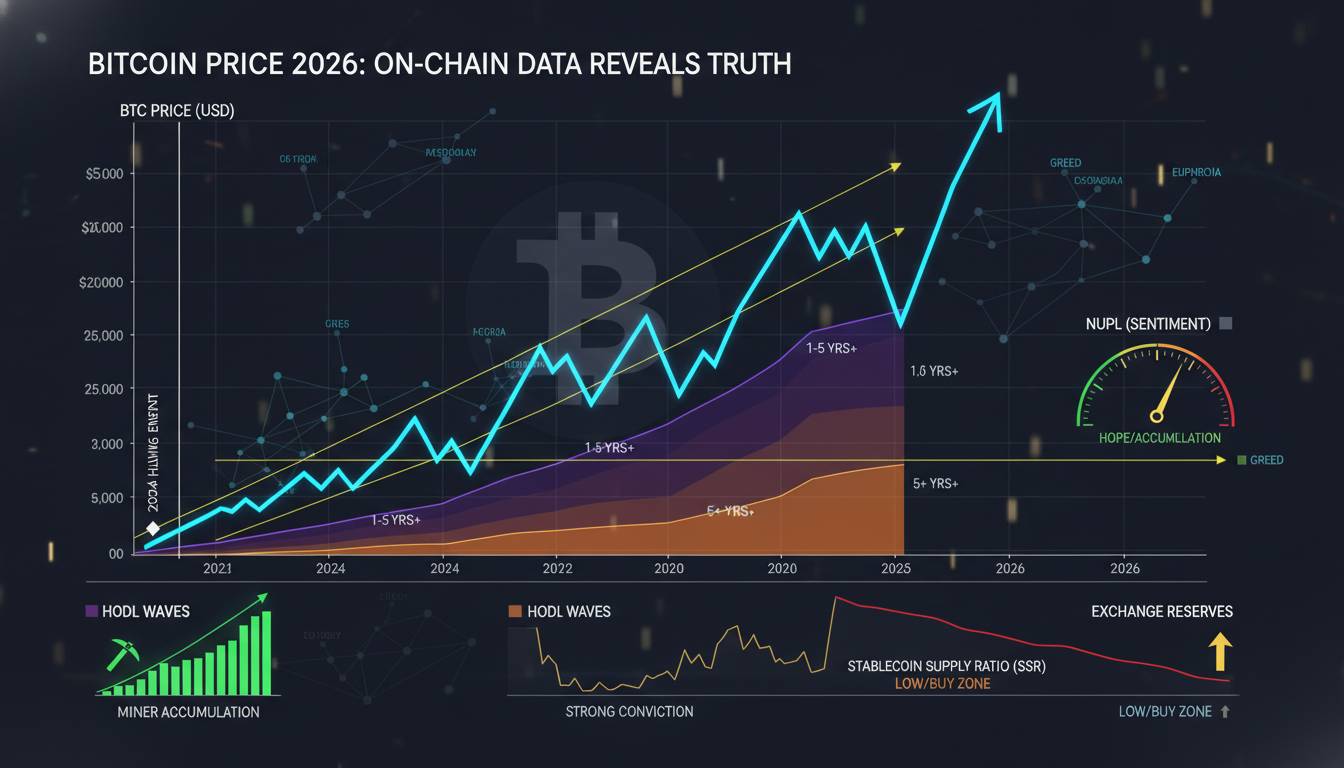
Exchange reserves measure how much Bitcoin is sitting on exchange wallets. When reserves rise rapidly, it typically signals that holders are preparing to sell—a leading indicator of distribution. When reserves fall, it suggests holders are withdrawing to cold storage, reducing sell-side liquidity.
Long-term holder (LTH) supply tracks Bitcoin that hasn’t moved in over 155 days. During crashes, LTH supply often increases as short-term holders panic-sell and long-term holders accumulate. In late 2022, LTH supply hit all-time highs as the price hit cycle lows—classic smart money behavior.
Realized cap HODL waves show the cost basis of coins currently held. When the price drops below the realized cap (the average price paid for all coins in existence), it indicates that the majority of holders are underwater—a condition that often precedes capitulation but also sets up strong support floors.
On-chain data is not a crystal ball. It tells you what happened, not what will happen. But it’s one of the few data sources that isn’t polluted by high-frequency trading algorithms or wash trading.
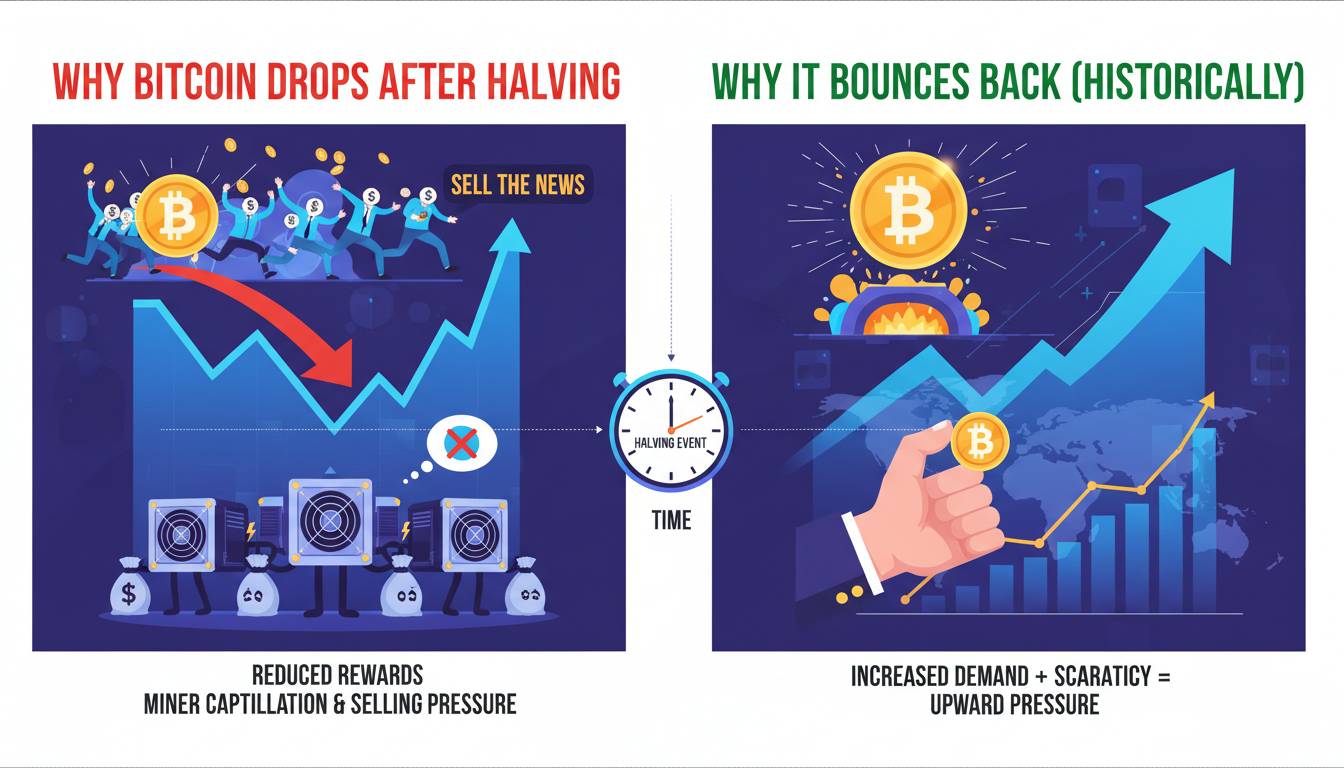
7. Network Health and Mining Dynamics
Bitcoin’s mining ecosystem can amplify crashes or create floors under the price. When mining becomes unprofitable, smaller miners capitulate—their hardware gets turned off, and their Bitcoin holdings get sold to cover costs.
During the 2022 crash, the hashrate dropped significantly as energy costs rose and the price fell. Several publicly traded miners filed for bankruptcy or sold their hardware at a loss. This might seem like a negative, but it’s actually part of Bitcoin’s self-correcting mechanism: when mining difficulty adjusts downward, surviving miners become more profitable, which stabilizes the network.
The metric to watch is the Puell Multiple, which divides the daily miner revenue (in USD) by the 365-day moving average of miner revenue. When the Puell Multiple is very low, miners are earning significantly less than their yearly average—a condition that has historically coincided with cycle bottoms.
The mining dynamic creates a floor in two ways: first, as unprofitable miners exit, the sell pressure from mining operations decreases. Second, low miner revenue historically precedes price recoveries as the network rebalances.
8. Geopolitical and Macroeconomic Events
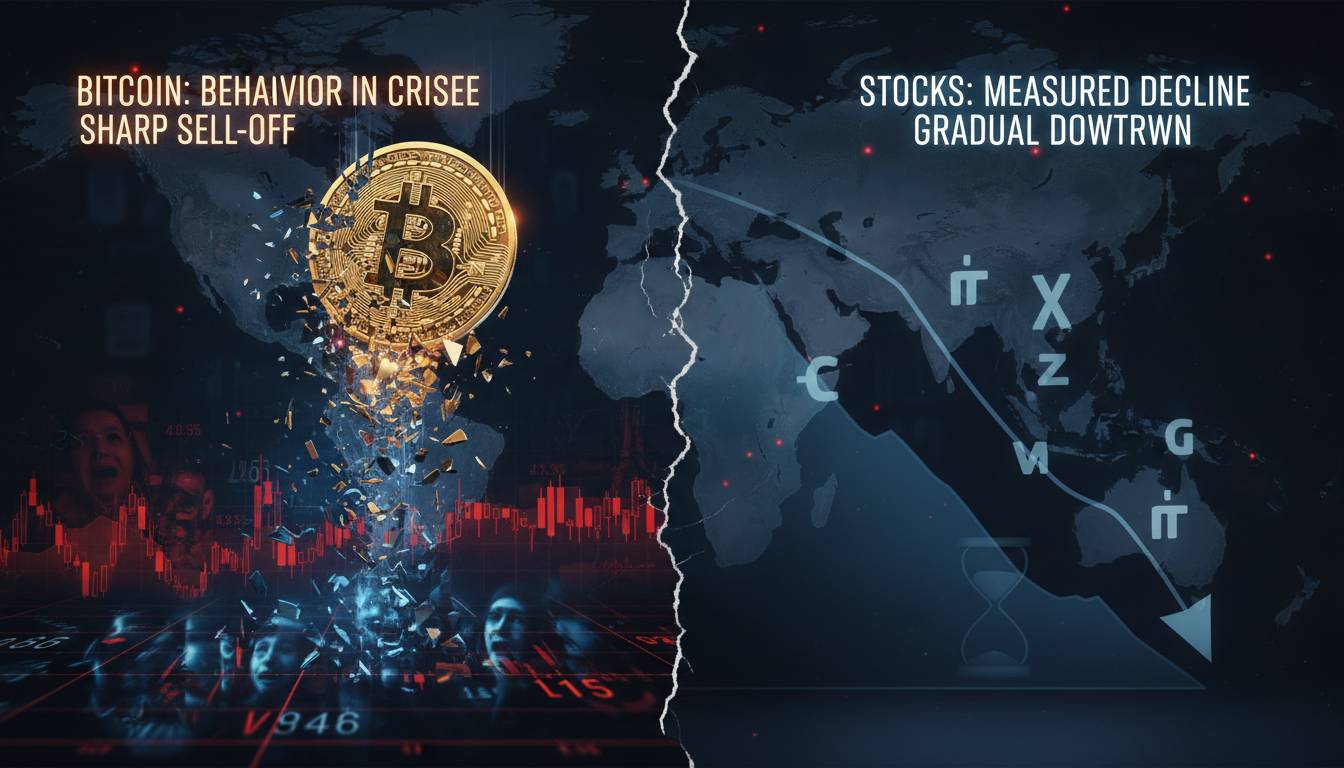
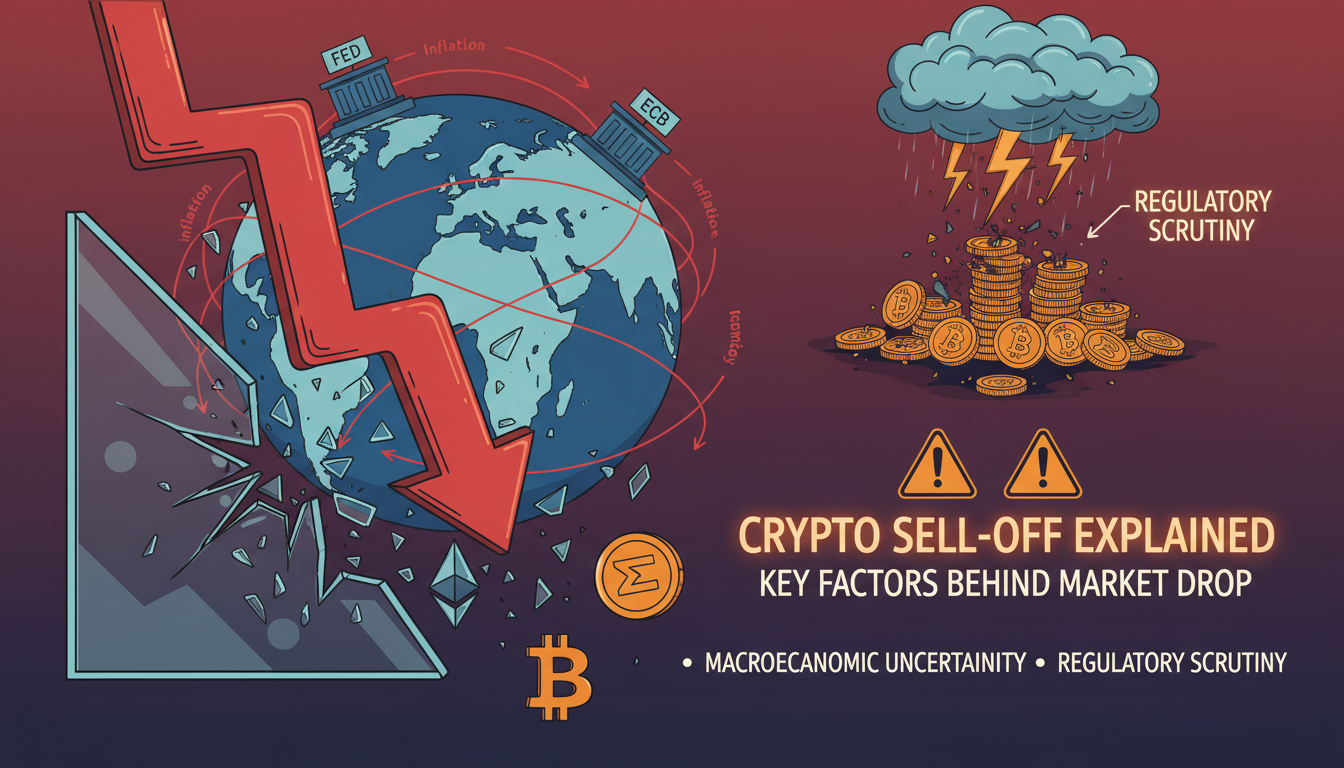
Sometimes Bitcoin crashes for reasons that have nothing to do with crypto. Geopolitical events—wars, sanctions, elections, banking crises—can trigger flight-to-safety behavior that benefits assets like the US dollar and gold while hurting speculative assets.
The 2022 Russia-Ukraine war initially caused Bitcoin to drop alongside equities, as risk assets were sold to raise liquidity. However, the war also accelerated adoption in both Russia and Ukraine as citizens sought alternatives to rapidly depreciating currencies. The long-term impact on Bitcoin in those regions was arguably positive, even though the immediate market reaction was negative.
Banking crises present a more nuanced picture. The March 2023 banking collapses—Silicon Valley Bank, Signature Bank, Credit Suisse—initially caused Bitcoin to drop before it rallied sharply. The logic: when traditional banks fail, Bitcoin’s narrative as a non-correlated store of value gains credibility.
Distinguish between shocks that affect all risk assets (where Bitcoin will likely follow the market down) versus events that specifically challenge the traditional financial system (where Bitcoin can benefit long-term, even if it drops initially).
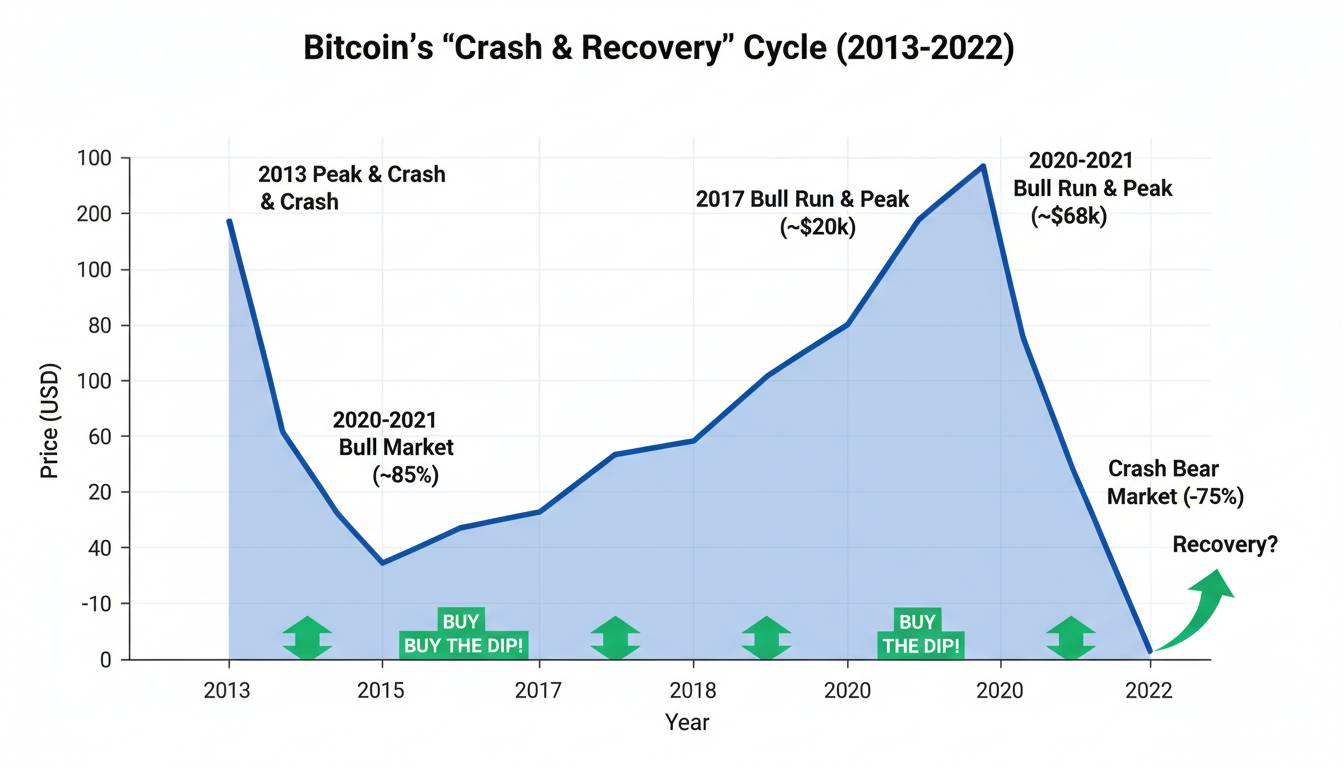
9. Historical Pattern Recognition and Cycle Analysis
Bitcoin has crashed before—many times. While no two crashes are identical, certain patterns repeat with enough frequency to be useful.
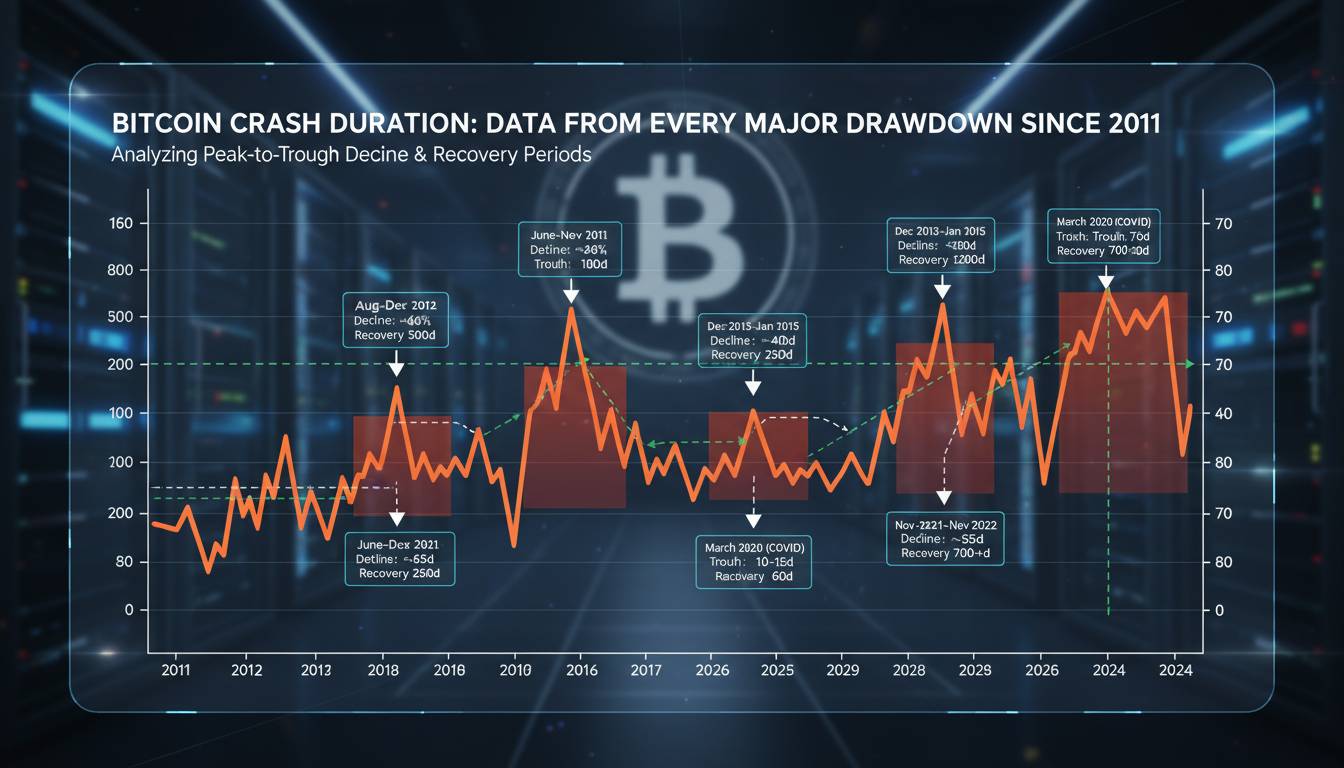
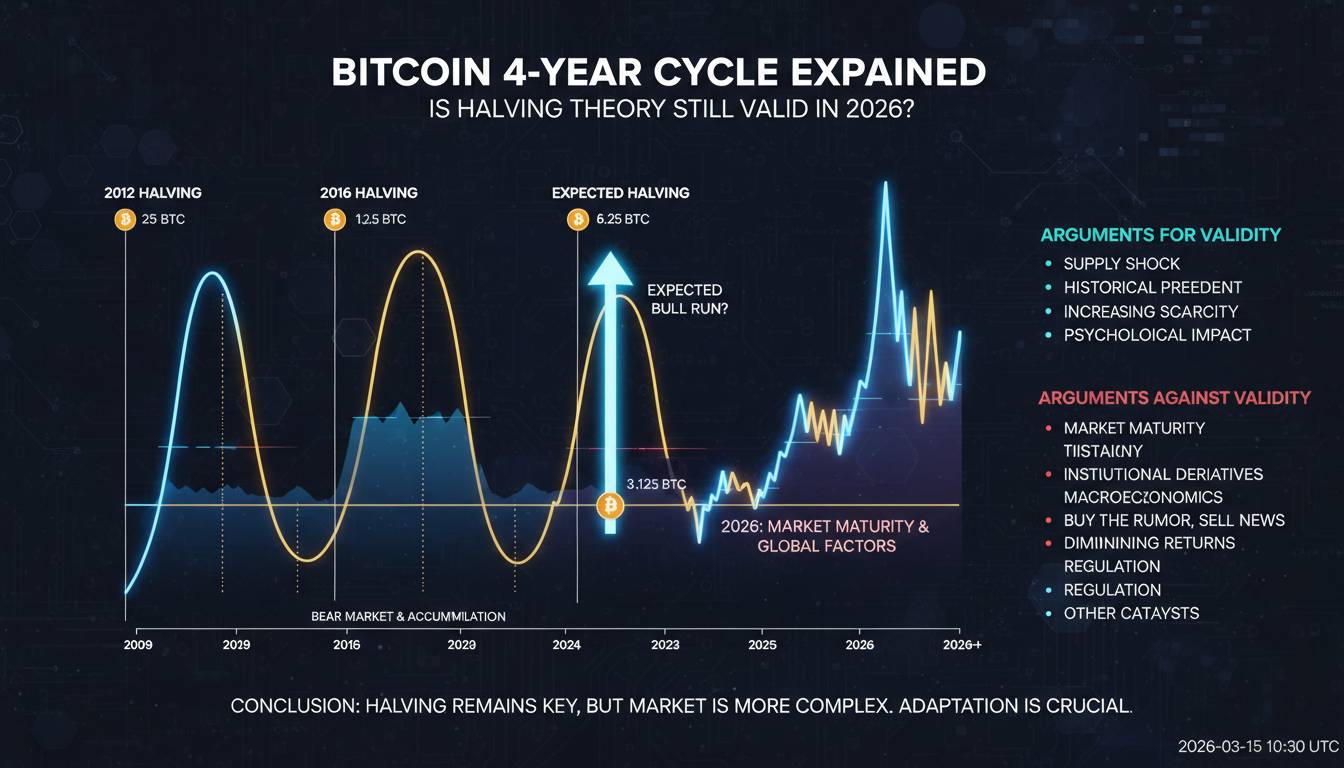
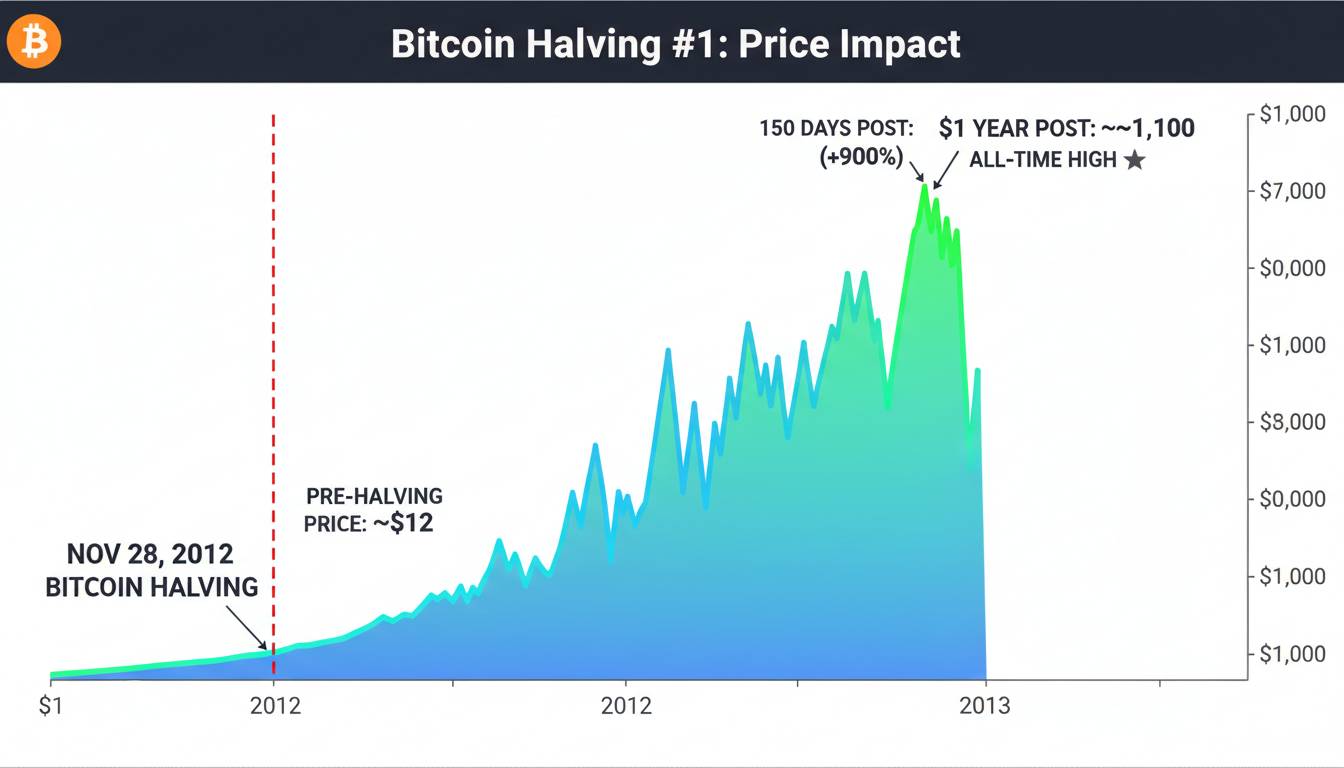
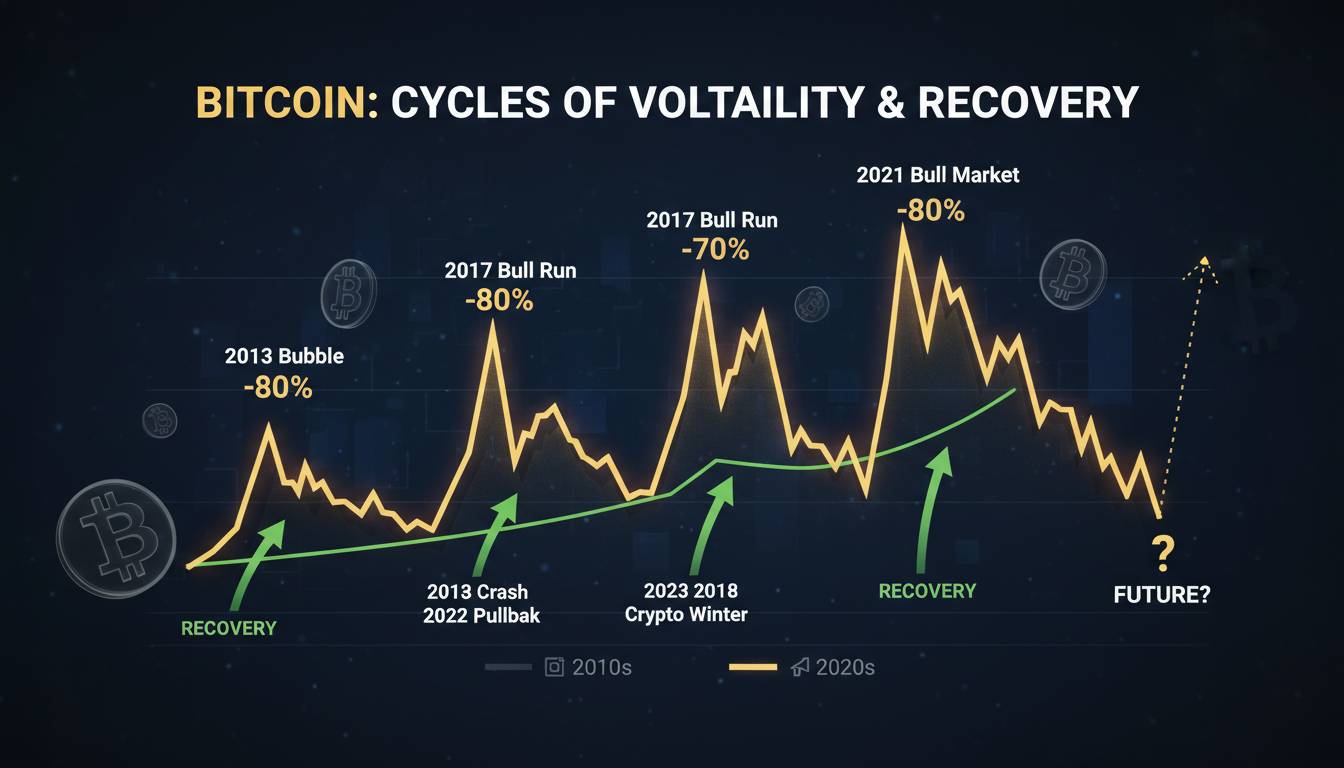
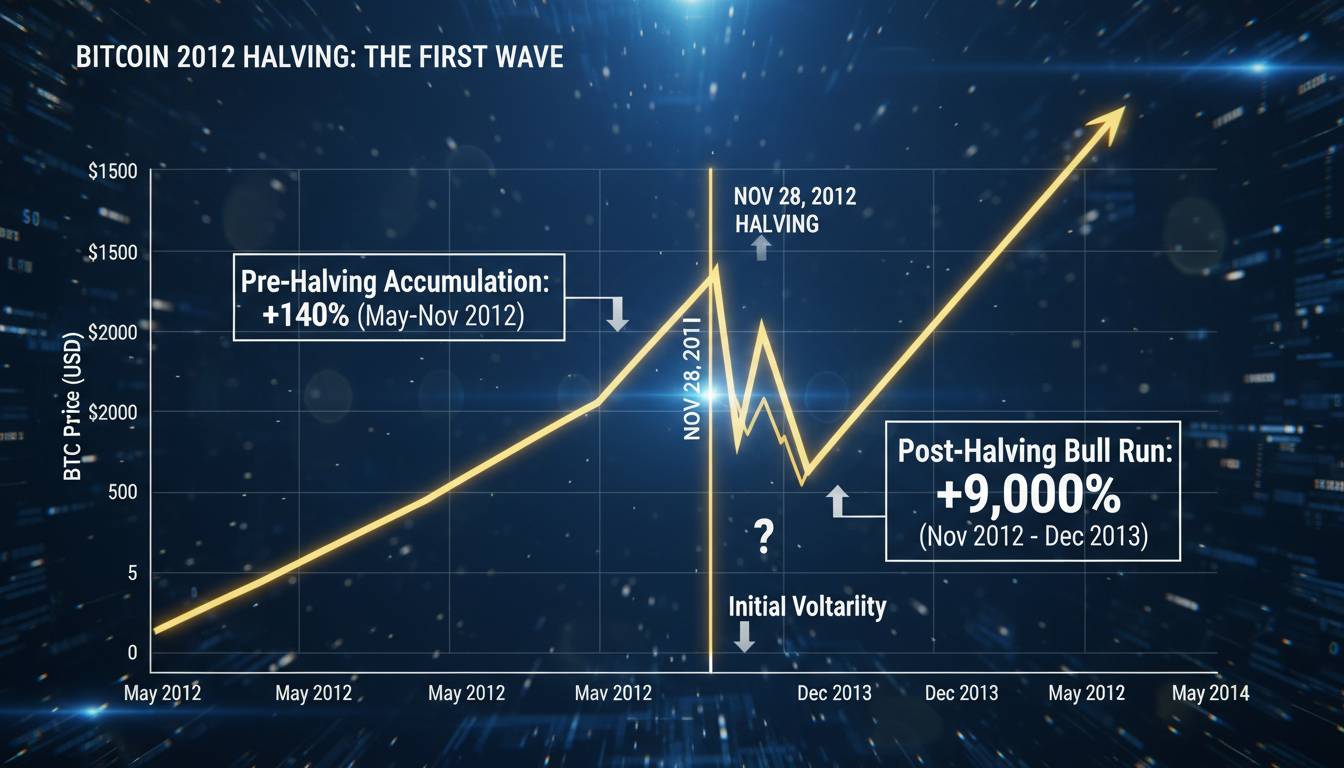
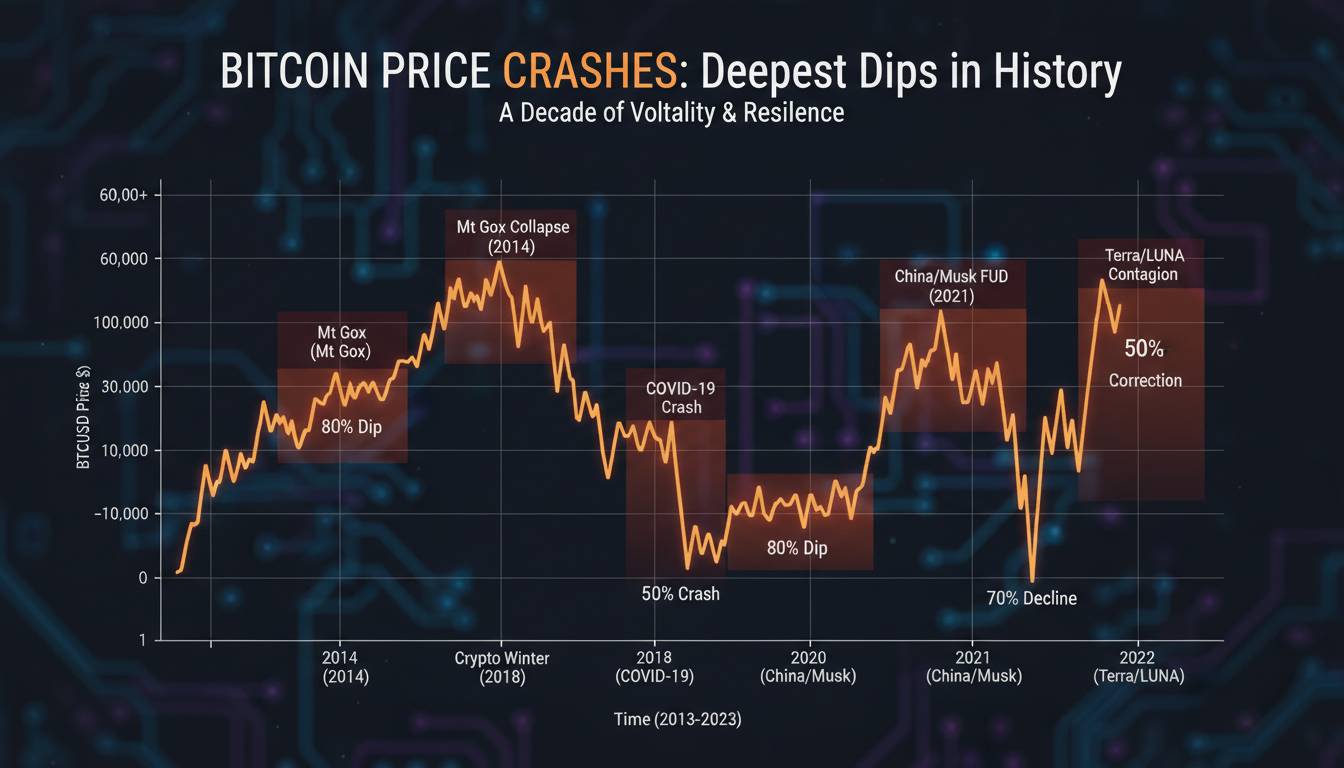
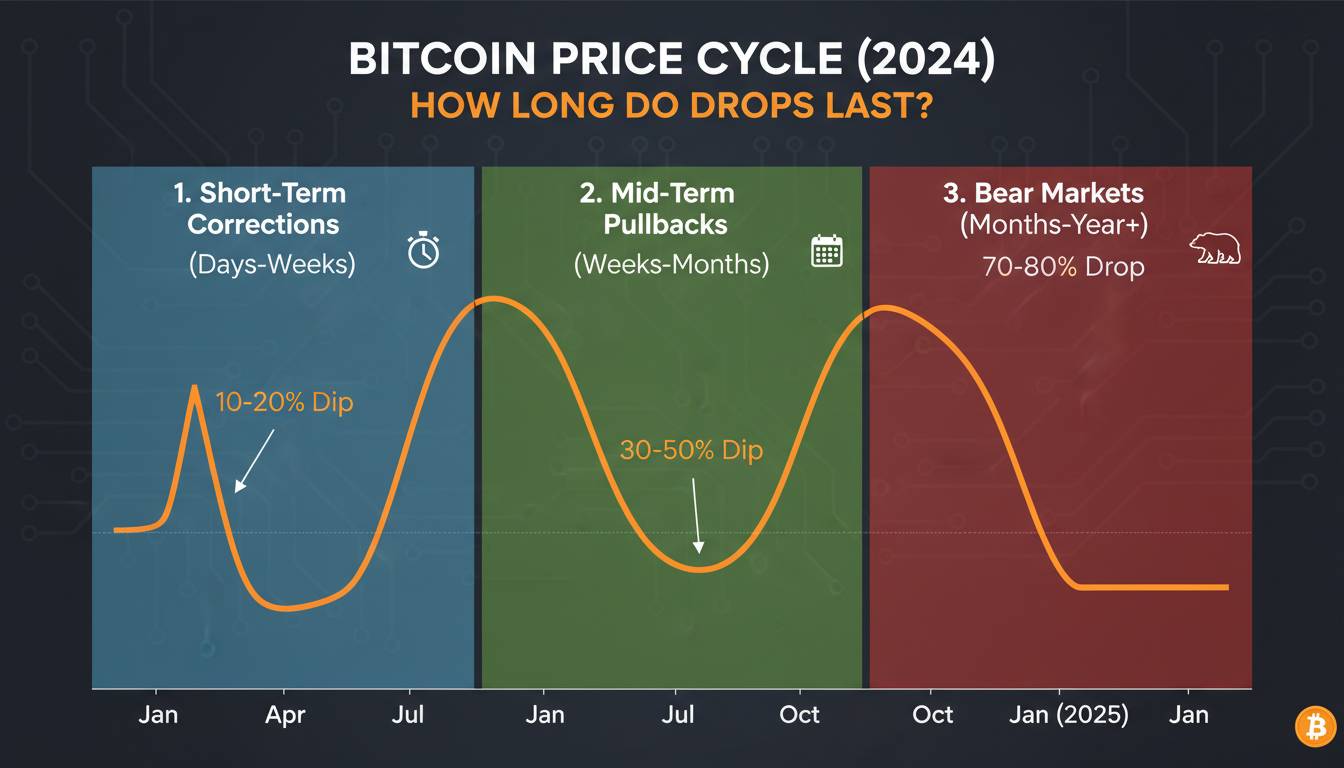
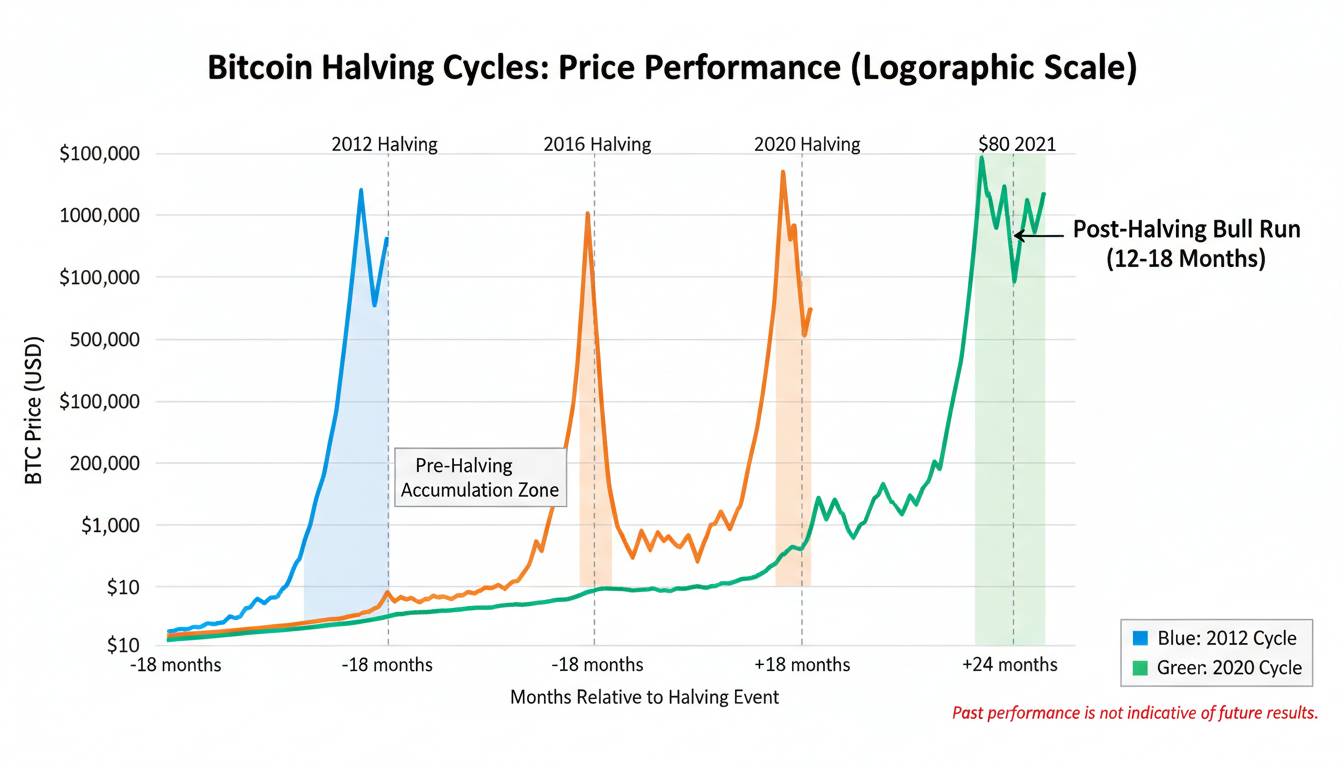
The four-year cycle remains the most reliable framework, driven by the halving events that reduce Bitcoin’s issuance rate every 210,000 blocks (roughly four years). Historically, bull markets have begun 12-18 months after each halving, followed by crashes that wipe out 70-90% of the gains.
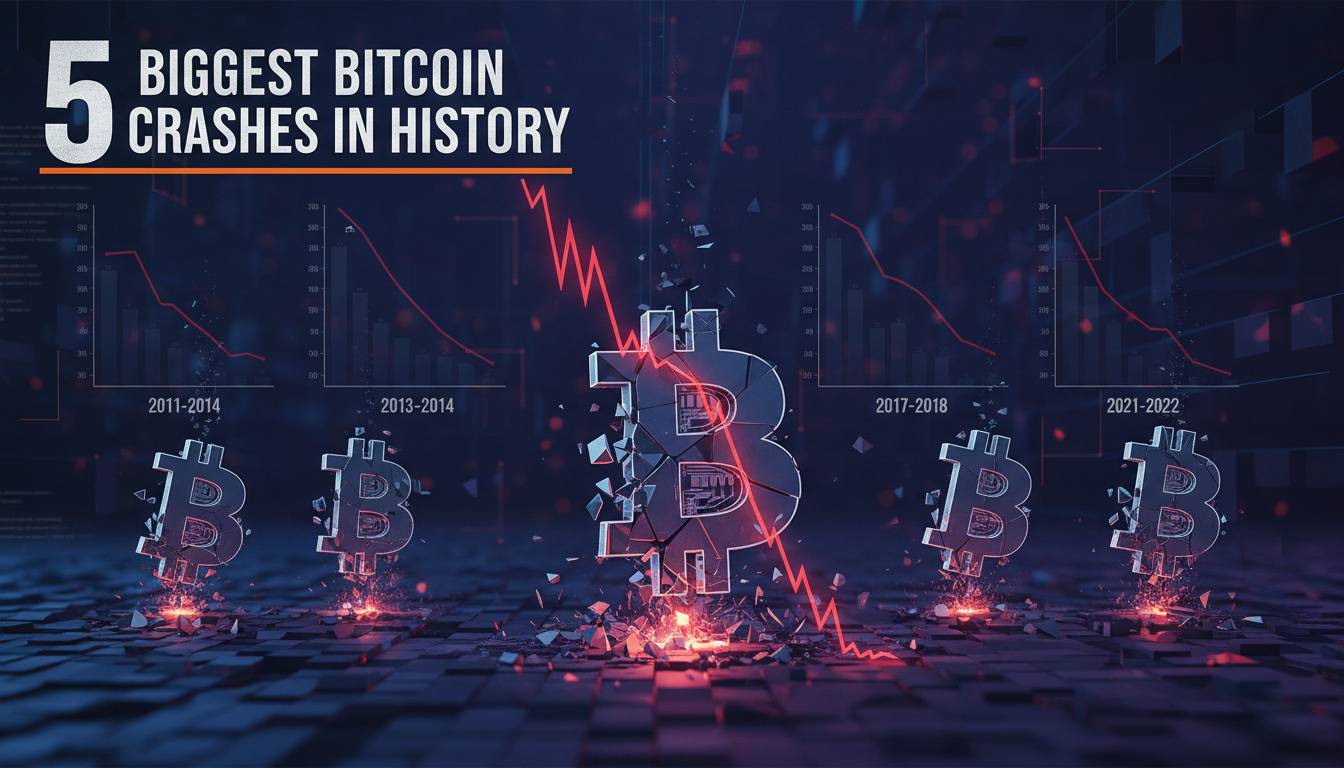
The 2013 crash saw Bitcoin go from $1,100 to under $200 (an 80% drop). The 2017 crash saw it go from $20,000 to $3,200 (an 84% drop). The 2021-2022 crash saw it go from $69,000 to $16,000 (a 77% drop). The pattern isn’t precision, but the magnitude is consistent.
The challenge with cycle analysis: it works until it doesn’t. There’s no guarantee the four-year cycle will continue indefinitely, especially as derivatives markets and institutional adoption change the dynamics. What cycle analysis offers is a probabilistic framework—not a prediction, but a way to set reasonable expectations.
10. The Psychology of Panic and the Limits of Analysis
The final factor isn’t a data point or a chart pattern. It’s the human element.
Every crash triggers the same psychological cascade: denial (“this is a buying opportunity”), then fear (“what if it goes to zero?”), then capitulation (“I should have sold earlier”), then despair (“I’ll never recover”). These emotions are predictable and universal. They’re also the reason most people buy at the top and sell at the bottom.
The uncomfortable truth: no framework can fully insulate you from the emotional toll of a 50% drawdown. What a framework can do is give you a structure for decision-making so that when panic sets in, you have predetermined rules to follow.
This is why every serious Bitcoin investor should define their exit strategy before entering—not just take-profit targets, but stop-loss rules, rebalancing schedules, and criteria for when to stop looking at charts. The crashes aren’t the problem. The problem is reacting to crashes without a plan.
Conclusion
This framework gives you ten lenses through which to examine any Bitcoin crash. The next time Bitcoin drops 15% in an hour, instead of panic-googling “why did Bitcoin drop today,” you can work through the checklist: Is the macro environment turning bearish? Did we break a key technical level? Is leverage getting squeezed? Are on-chain metrics showing capitulation?
Not every crash requires action. Sometimes the best move is to do nothing—to hold, to wait, to trust the framework rather than react to emotion.
What remains genuinely unresolved is whether this framework will work as Bitcoin matures. As derivatives markets grow, as institutional participation increases, and as regulatory frameworks solidify, the dynamics that have driven past crashes may evolve or disappear entirely. The next major crash might look nothing like 2014, 2017, or 2022.
What won’t change is human psychology. Greed, fear, and the herd instinct will continue to drive markets, and those who understand those dynamics—rather than trying to predict them—will be better positioned to survive whatever comes next.