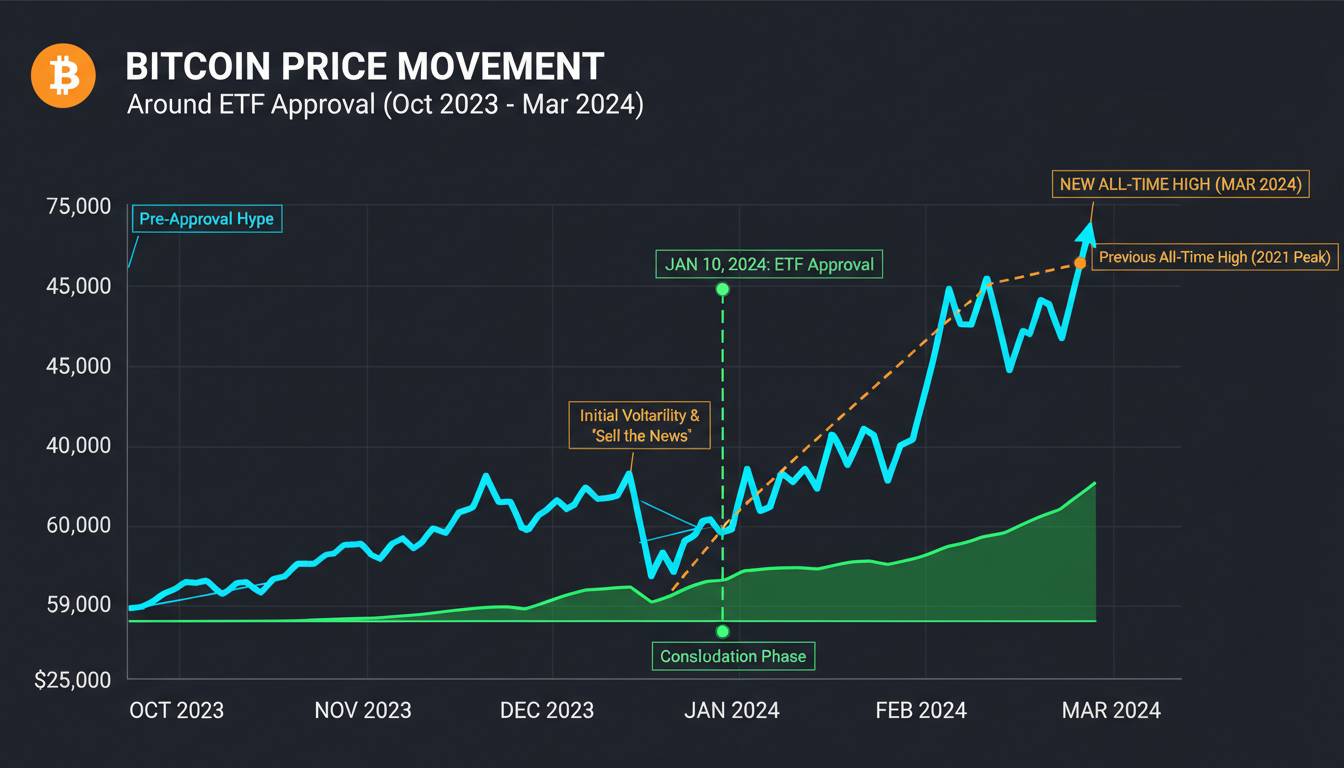

The days when a handful of Reddit threads and Twitter speculation could move Bitcoin’s price by double-digit percentages are over. Since the SEC approved spot Bitcoin ETFs in January 2024, the market has undergone a structural shift that most retail traders still haven’t fully processed. Institutional capital—measured through daily ETF flow data—has become the primary price discovery mechanism for Bitcoin, replacing the on-chain metrics and social sentiment indicators that once ruled the market.
This isn’t a temporary adjustment or a market phase that will reverse. The $50 billion-plus in cumulative inflows into spot Bitcoin ETFs through 2024 and into 2025 has permanently altered how Bitcoin prices move throughout the trading day. Understanding why institutional flows now drive daily price action isn’t optional anymore for anyone taking this market seriously—it’s essential.
What Institutional Bitcoin Flows Actually Measure
When analysts and traders talk about institutional flows in the Bitcoin market, they’re referring specifically to the net buying and selling activity through regulated investment vehicles—primarily the spot Bitcoin ETFs that launched in early 2024. These ETFs, including BlackRock’s iShares Bitcoin Trust (IBIT) and Fidelity’s Wise Origin Bitcoin Fund (FBTC), hold actual Bitcoin on behalf of their shareholders, and their daily purchase and redemption activity creates a measurable, reportable flow of capital into or out of the asset.
The data comes from the ETF issuers themselves, who report daily share creation and redemption numbers to the National Securities Clearing Corporation (NSCC). Crypto analytics platforms like CryptoQuant, Glassnode, and IntoTheBlock aggregate this data and present it in accessible formats, typically showing net inflows (more money going into the ETF than out) or net outflows (the opposite). This number, usually expressed in millions or hundreds of millions of dollars per day, has become the most-watched data point in the Bitcoin market.
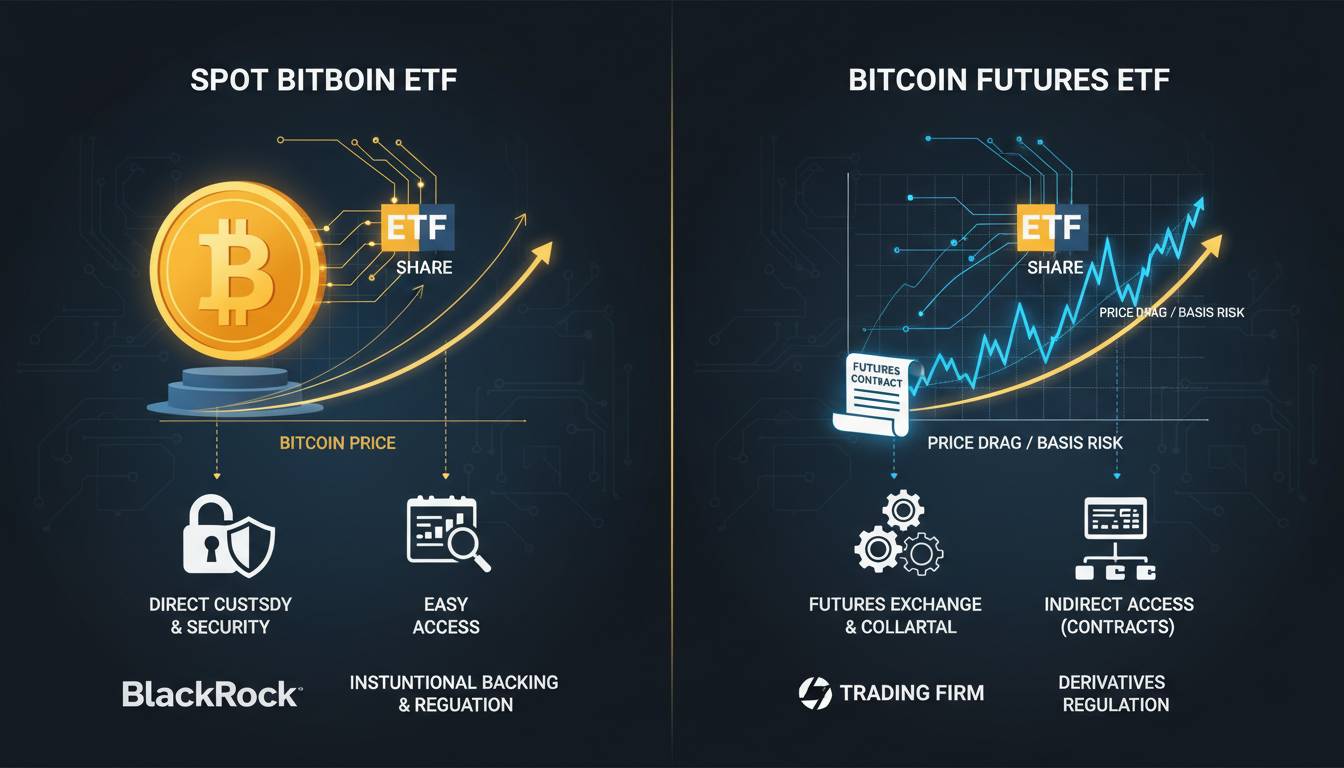
The key insight that many newcomers miss is that these flows represent actual capital movements into the underlying asset. When IBIT reports $500 million in inflows on a given day, that money is actually being used to buy Bitcoin—it’s not derivative exposure or leverage. The ETF purchases Bitcoin to back newly created shares, and this buying pressure directly affects the spot price. This is fundamentally different from the futures-based institutional activity that dominated before spot ETFs existed, where institutional positions could move price without any actual Bitcoin changing hands.
How ETF Inflows Translate Into Price Action
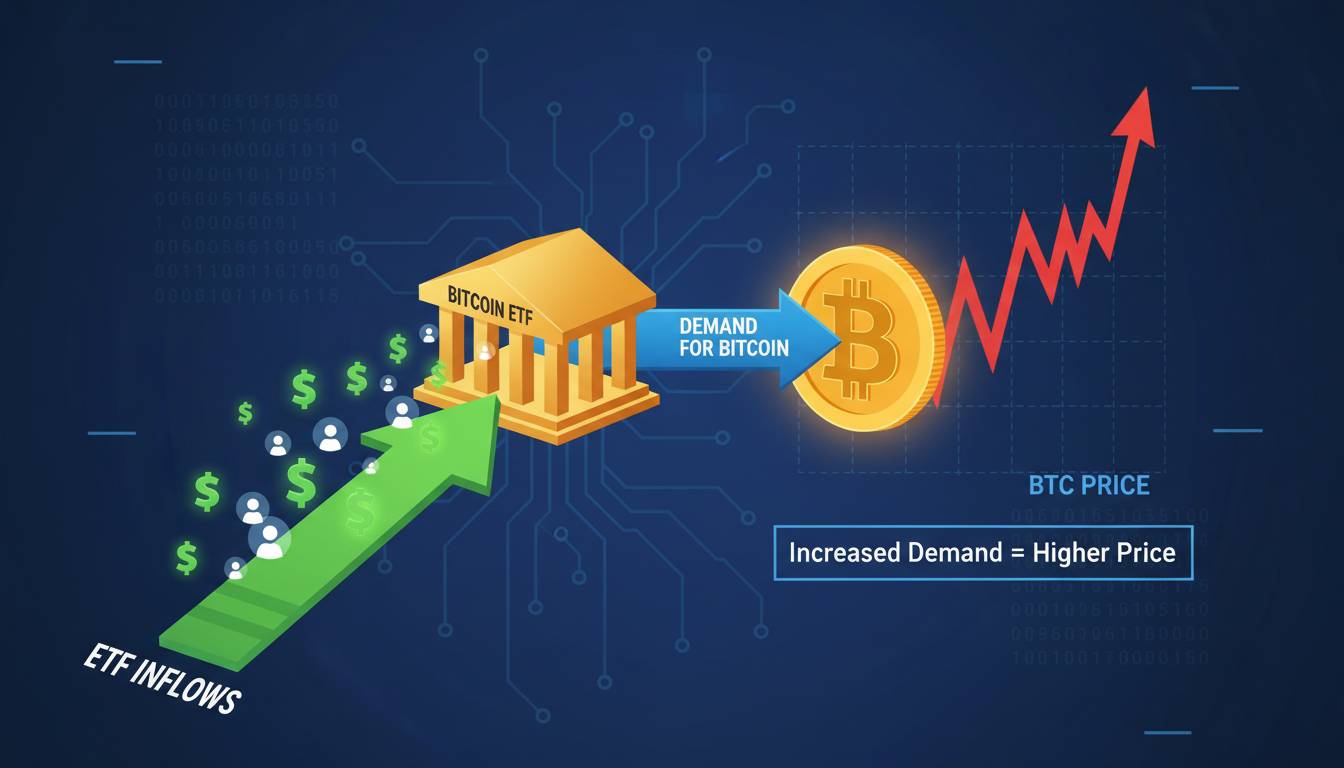
The mechanism through which ETF flows affect Bitcoin price is straightforward in theory but nuanced in practice. When an ETF experiences significant net inflows, the issuer must purchase Bitcoin on the open market to maintain the fund’s backing ratio. This creates immediate buying pressure that, depending on market liquidity, can move the spot price upward. Conversely, net outflows require the ETF to sell Bitcoin, creating selling pressure.
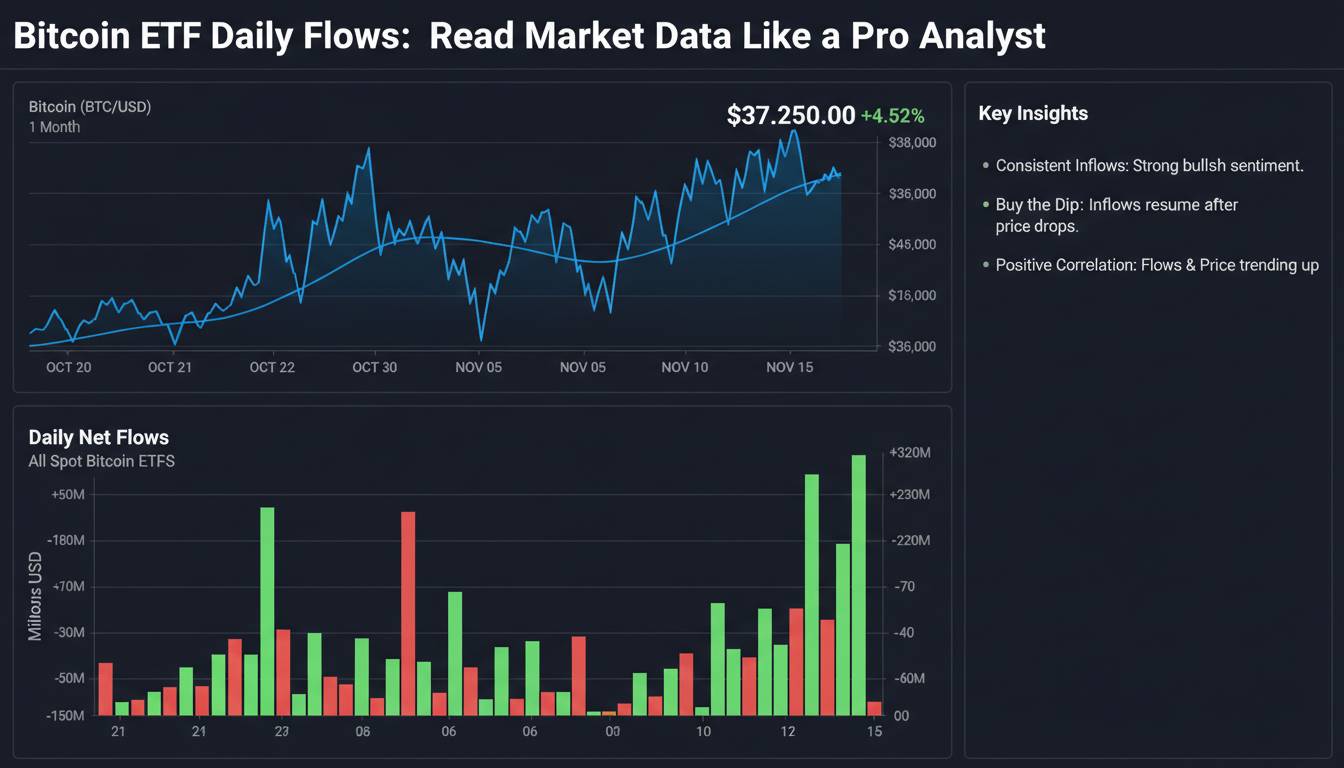
What makes this particularly significant for daily price action is the sheer scale. During the first quarter after spot ETF approval, daily inflows frequently exceeded $500 million—sometimes hitting $1 billion or more on particularly strong days. For context, Bitcoin’s daily trading volume typically ranges from $30 billion to $60 billion, so these flows represent a meaningful percentage of total market activity. When you’re talking about hundreds of millions of dollars in forced buying or selling every single day, the price impact becomes almost mechanical.
The correlation between flows and price has been remarkably strong since the ETFs launched. Analyzing the data from January 2024 through early 2025, days with significant net inflows consistently showed price appreciation, while outflow days correlated with price declines. This isn’t coincidental—it’s structural. The ETF flows create a direct, predictable demand/supply dynamic that the market prices in almost immediately.
Glassnode’s research has documented this relationship extensively, noting that the correlation coefficient between daily ETF net flows and Bitcoin’s daily returns has hovered around 0.6 to 0.7 since launch—extremely high for a single variable in a complex market. Analysts at CryptoQuant have observed that ETF flow data now explains a larger percentage of Bitcoin’s daily variance than traditional indicators like hash rate, exchange reserves, or even traditional market correlations with tech stocks.
The Shift From Retail Dominance to Institutional Control
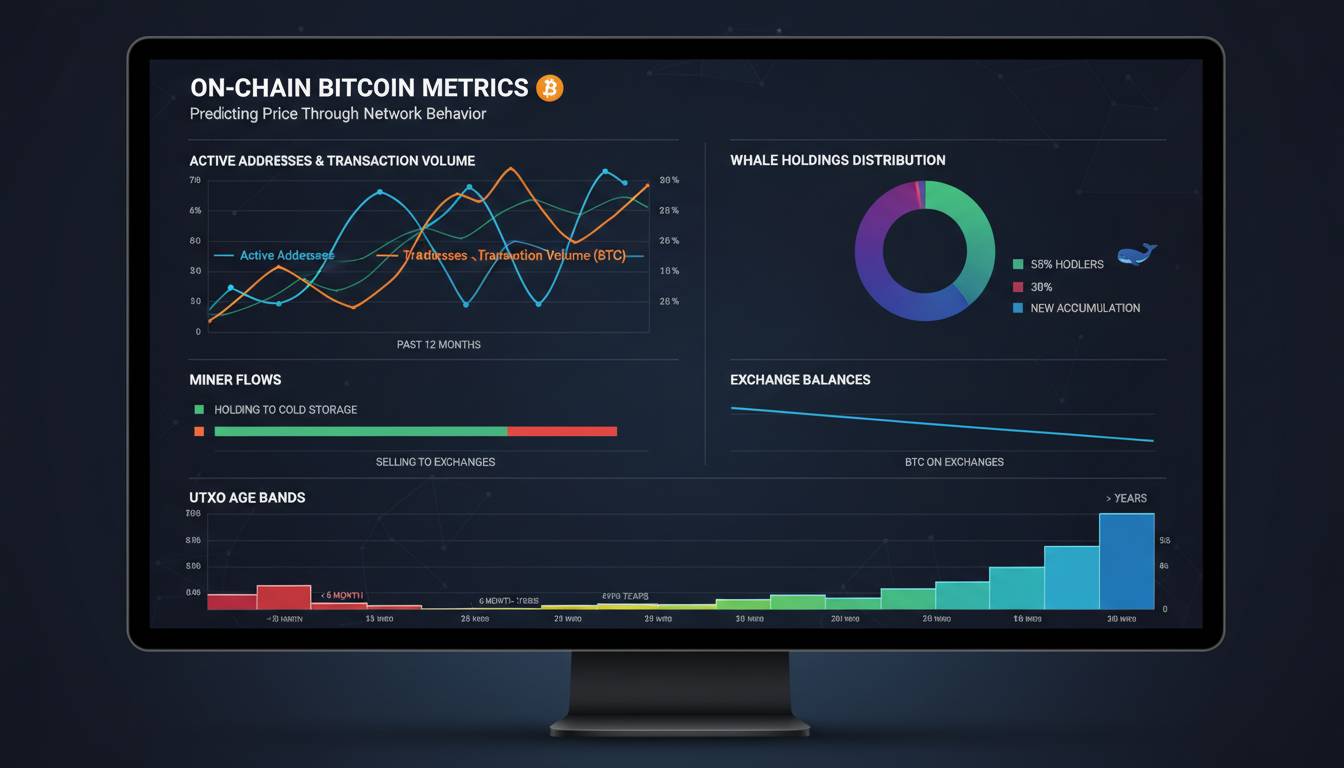
Before spot ETFs existed, Bitcoin’s price movements were primarily driven by retail sentiment and behavior. On-chain metrics served as proxies for retail activity—exchange inflows showed when holders were getting nervous, wallet age distributions revealed when long-term holders were selling, and social media sentiment tracked retail enthusiasm. These weren’t perfect indicators, but they captured the market’s dominant force.
The arrival of spot ETFs fundamentally changed this dynamic. Within months of launch, institutional investors had become the dominant force in Bitcoin allocation. By mid-2024, the combined holdings of the top spot Bitcoin ETFs exceeded $50 billion, making them meaningful participants in the market. BlackRock’s IBIT alone accumulated over $20 billion in assets faster than any ETF in history.
This shift matters because institutional participants behave differently than retail traders. Institutions tend to be more strategic, less emotional, and capable of deploying significantly larger capital positions. More importantly for daily price action, institutional flows are more predictable and measurable. While retail sentiment can shift on a viral tweet, ETF flows are reported daily with a high degree of accuracy. This transparency has changed the market’s information environment.
The market has responded by pricing in ETF flows more aggressively than almost any other fundamental factor. Traders now monitor flow data in real-time, with some platforms offering intraday estimates based on volume patterns. The result is a market where daily price action is increasingly explained by yesterday’s or today’s flow data, rather than by the broader macroeconomic factors or sentiment indicators that previously dominated.
Current Institutional Holdings: The Numbers That Matter
As of early 2025, the spot Bitcoin ETF landscape has consolidated significantly from the initial eleven products that launched in January 2024. The top holdings tell an important story about institutional penetration into Bitcoin.
BlackRock’s iShares Bitcoin Trust (IBIT) has emerged as the dominant product, accumulating over $50 billion in assets under management by late 2024. This makes it one of the largest single holders of Bitcoin in the world—larger than most national sovereign wealth funds and comparable to the holdings of major publicly-traded companies that have added Bitcoin to their treasuries. Fidelity’s Wise Origin Bitcoin Fund (FBTC) follows as the second-largest, with approximately $10 billion in assets.
The total combined holdings across all spot Bitcoin ETFs exceed $90 billion as of early 2025, representing approximately 4-5% of Bitcoin’s total market capitalization. While this percentage might seem small, it represents a controlling interest in daily price discovery because the flows are concentrated, predictable, and mechanically impactful. Retail holders, by contrast, are fragmented across millions of wallets—impossible to coordinate, difficult to measure in aggregate, and far less likely to act in unison.
This concentration of holdings has created a new dynamic where a relatively small number of institutional participants can move the market through their allocation decisions. When BlackRock adjusts its holdings or when a major institutional investor adds to their position through the ETF structure, the market feels it immediately.
Why Traditional Indicators Have Taken a Back Seat
One of the most significant changes in Bitcoin market dynamics since the ETF launch has been the diminished importance of traditional on-chain indicators. Metrics that retail traders and analysts relied on for years—exchange reserves, HODLer behavior, hash rate, SOPR (Spent Output Profit Ratio)—have seen their predictive power decrease substantially.
Exchange reserves, which measure how much Bitcoin is held on trading platforms, were once reliable indicators of selling pressure. The logic was simple: when Bitcoin moves to exchanges, holders intend to sell. But this metric has become less useful as the ETF structure provides an alternative to exchange custody. Institutions don’t need to hold their Bitcoin on exchanges—they can use the ETF, which uses cold storage custodians. So exchange reserves now primarily reflect retail behavior, not the institutional flows that drive price.
Similarly, metrics like the Bitcoin Rainbow Chart, MVRV ratio, and various SOPR variations have shown mixed effectiveness since ETFs launched. The correlation between these traditional indicators and daily price action has weakened noticeably. This doesn’t mean they’re useless—they still provide valuable context about overall market health and potential long-term positioning. But for the specific question of what will move Bitcoin tomorrow or next week, ETF flows have become the superior data source.
This shift has been difficult for some analysts who built their reputations on on-chain analysis. The market has effectively told them that their expertise, while still valuable, is no longer the primary driver of price discovery. Some have adapted by incorporating ETF flow data into their models; others continue to emphasize on-chain metrics and have seen their market influence diminish.
The Counterintuitive Reality: Flows Don’t Always Lead Price
Here’s where I need to acknowledge something that most articles on this topic gloss over: the relationship between ETF flows and Bitcoin price isn’t perfectly causal in either direction. While strong inflows generally correspond with price appreciation, the timing is often backwards from what people assume.
Traders frequently behave as though today’s inflows will cause tomorrow’s price increase. But the data suggests the market often prices in expected flows before they actually occur. When an ETF reports massive inflows, the price has frequently already moved in anticipation. This creates a frustrating situation where traders trying to use flow data for timing find themselves buying after the move has already happened.
The reality is more complex: flows both cause price movements and reflect anticipated ones. Large institutional investors don’t typically dump hundreds of millions into an ETF on a whim—they build positions over time based on research, allocation decisions, and market conditions. By the time the daily flow number hits the wire, the market has often already absorbed the information. The traders who benefit most are those who can anticipate flow trends before they’re reported, not those who react to the data after the fact.
This is a genuine limitation of flow-based analysis that you won’t read about in most places. The data is backward-looking by its nature, and the market’s efficiency at incorporating it means the actionable signal is weaker than the raw numbers suggest.
How to Track and Interpret Institutional Flow Data
For readers looking to incorporate flow analysis into their Bitcoin strategy, understanding where to find data and how to interpret it is crucial. The primary sources are the ETF issuers themselves, which file Form 8-K with the SEC daily for share creation and redemption activity. However, most traders rely on aggregated data from analytics platforms.
CryptoQuant offers a professional-grade ETF flow dashboard that breaks down daily activity by fund, including both net flows and the underlying Bitcoin purchases/redemptions. Their model calculates “real” flows by adjusting for the premium/discount to net asset value that ETFs sometimes trade at, providing a more accurate picture of actual Bitcoin buying. Glassnode’s institutional flows data is similarly comprehensive and includes historical comparisons.
IntoTheBlock’s IOT blockchain analysis complements this with on-chain context—you can see not just the ETF flows but also what the broader market is doing, identifying divergences between institutional and retail behavior. When ETF inflows are positive but exchange reserves are rising (indicating net selling by non-ETF holders), that’s a more nuanced picture than flow data alone provides.
For practical interpretation, focus on sustained flow trends rather than daily noise. A single day of $100 million in inflows might reflect a large but isolated institutional purchase. But $500 million flowing in over five consecutive trading days suggests a structural demand trend that likely has further to run. Similarly, outflows that persist over weeks represent something more concerning for bulls than a one-day spike in selling.
What This Means for Traders and Investors
The structural shift toward institutional flow-driven price action has several practical implications that market participants should consider.
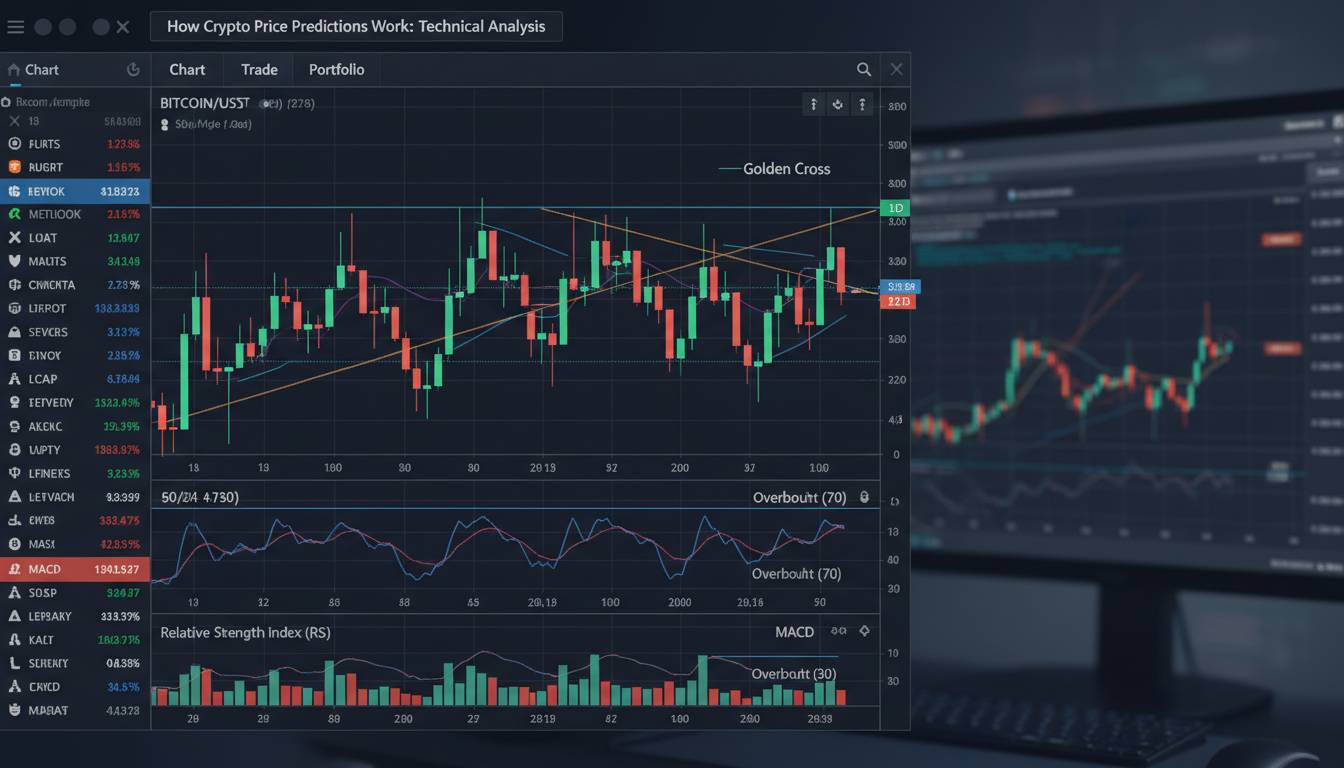
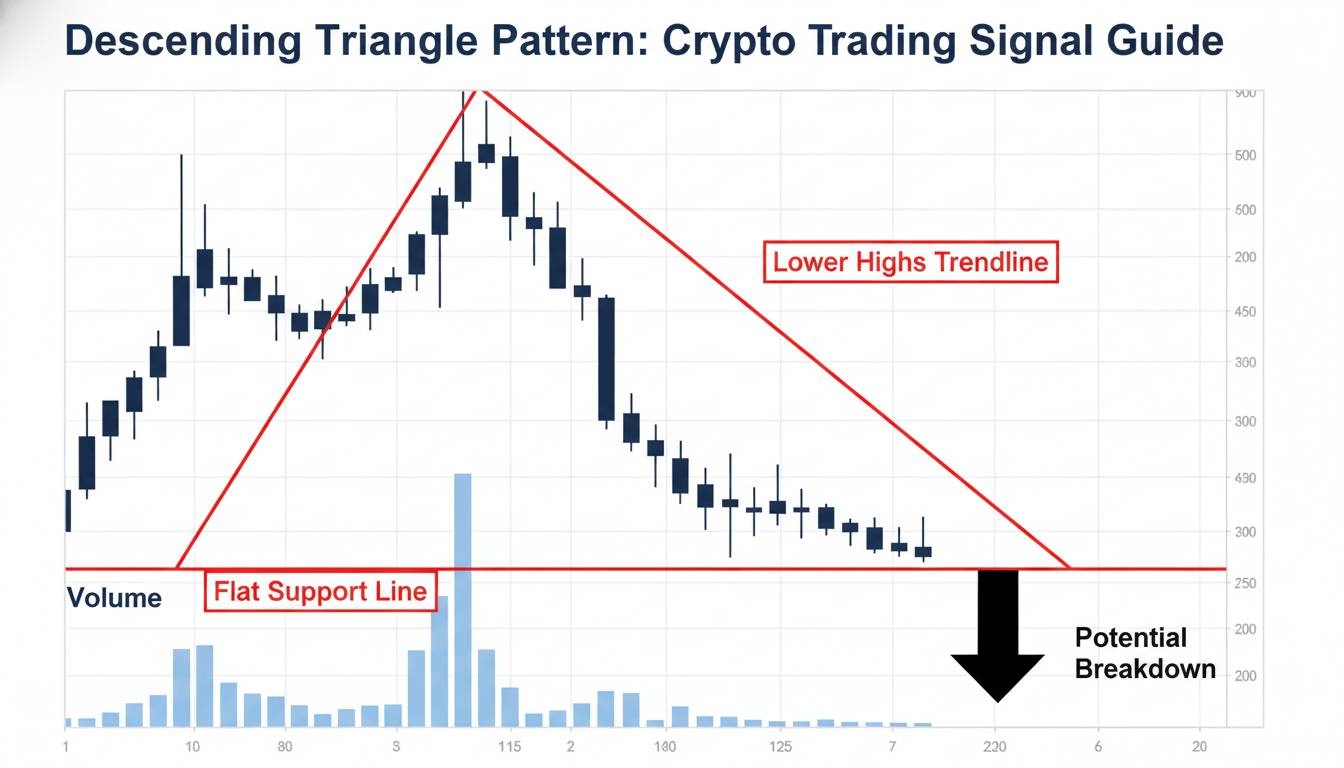
Traditional technical analysis has become less reliable. Chart patterns, support and resistance levels, and momentum indicators all assume that price reflects the aggregate behavior of market participants. When a significant portion of that behavior is driven by institutional allocation decisions that are transparent and measured, the price movements can be more “mechanical” and less subject to the historical patterns that technical analysts depend on.
The information advantage has shifted. Retail traders trying to compete on flow analysis are at a structural disadvantage—they receive the same public data as everyone else, but they lack the ability to anticipate flows before they happen. Institutions have research teams, relationships with ETF issuers, and the capital to position ahead of known catalysts. For retail, this means that pure flow-chasing is a losing strategy; the moves are often over by the time the data is widely known.
Long-term holders may benefit from this environment more than active traders. The consistent institutional demand created by ETF structures provides a floor for Bitcoin that didn’t exist in previous cycles. While this doesn’t prevent volatility or drawdowns, it does suggest that the fundamental demand picture for Bitcoin is stronger than ever before. The question isn’t whether institutions want Bitcoin exposure—they’ve clearly decided they do. The question is how they deploy that capital over time.
The Unresolved Question: What Happens When Flows Slow?
Despite the clear importance of institutional flows, one question remains genuinely open: what happens to Bitcoin’s price discovery mechanism when ETF flows eventually stabilize or decline? The current environment features exceptional net inflows, but this cannot continue indefinitely. At some point, institutional allocations will reach equilibrium, and the question becomes whether Bitcoin can maintain its upward trajectory without the constant demand from new ETF capital.
Some analysts argue that this isn’t a problem—that as ETFs reach saturation, the secondary market trading within the ETFs will provide sufficient liquidity and price discovery. Others worry that removing the steady inflow engine could expose Bitcoin to the same kind of speculative dynamics that characterized previous cycles, potentially leading to significant volatility.
I don’t have a confident answer to this, and I suspect neither do most of the analysts who work in this space. The spot Bitcoin ETFs have existed for barely over a year as of early 2025. We simply haven’t seen what a mature, equilibrium-state ETF market looks like for Bitcoin. The next few years will provide that data, and the traders who understand this structural question will be better positioned than those who assume the current flow dynamics are permanent.
What is clear is that for now, in this current market environment, institutional flows are the dominant driver of daily price action. Understanding how to track them, interpret them, and understand their limitations isn’t optional for anyone serious about Bitcoin markets—it’s foundational. The market has spoken, and it says institutional flows matter more than ever before.