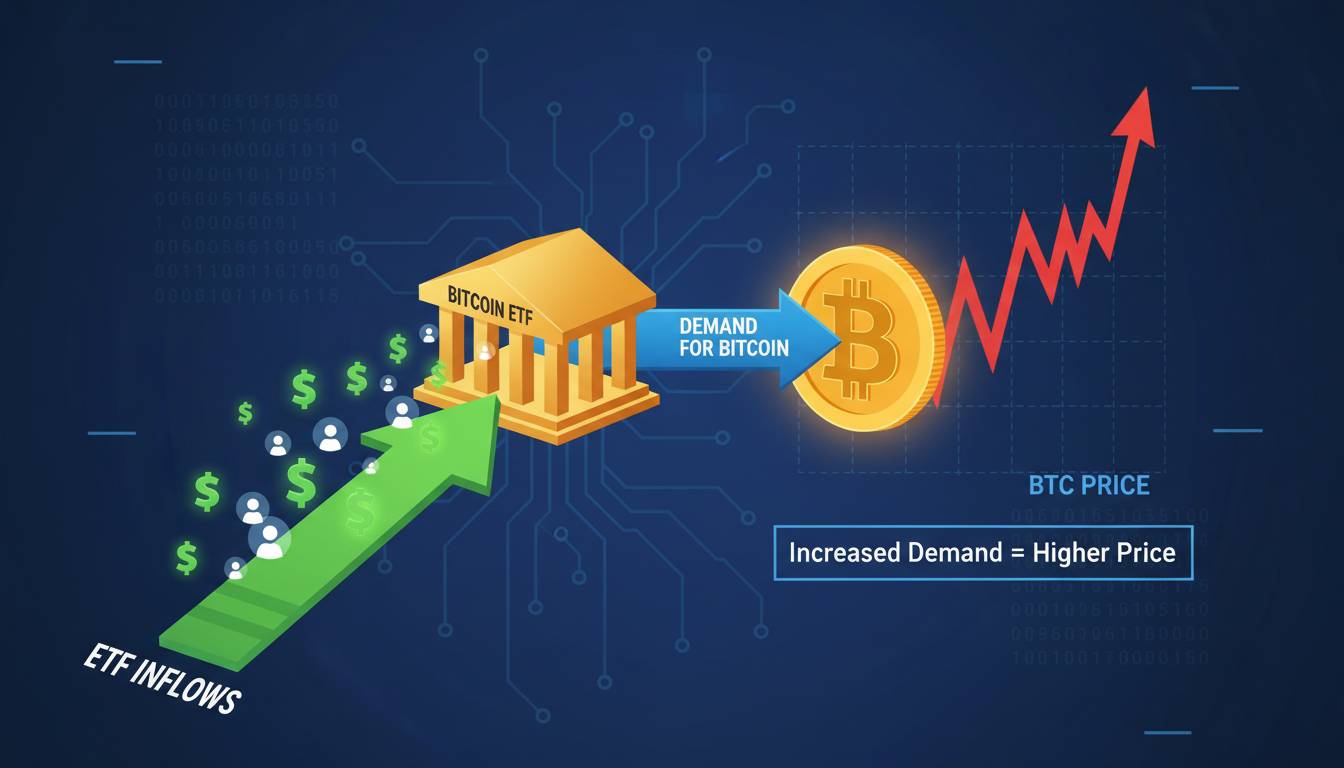
The Bitcoin ETF flow data is the most honest signal in the crypto market today. Unlike price action, which can be manipulated by trading algorithms in milliseconds, ETF flows represent real capital moving in and out of regulated investment vehicles. This capital is largely institutional or semi-institutional money—advisors, family offices, and high-net-worth individuals making deliberate allocation decisions. When you learn to read these flows correctly, you’re essentially getting a daily window into how sophisticated money is positioning itself toward Bitcoin. That’s valuable regardless of whether you’re timing trades or building long-term positions.
I’ve been tracking ETF flow data since the spot Bitcoin ETFs launched in January 2024, first at a crypto-native fund and now consulting for several institutional allocators. What I’ve learned is that most people get this data wrong because they don’t understand what they’re actually looking at. They see a $500 million inflow day and think it means Bitcoin is going up. They see outflows and panic. Neither response is correct. Let me show you how analysts actually process this information.
What Bitcoin ETF Flows Actually Measure
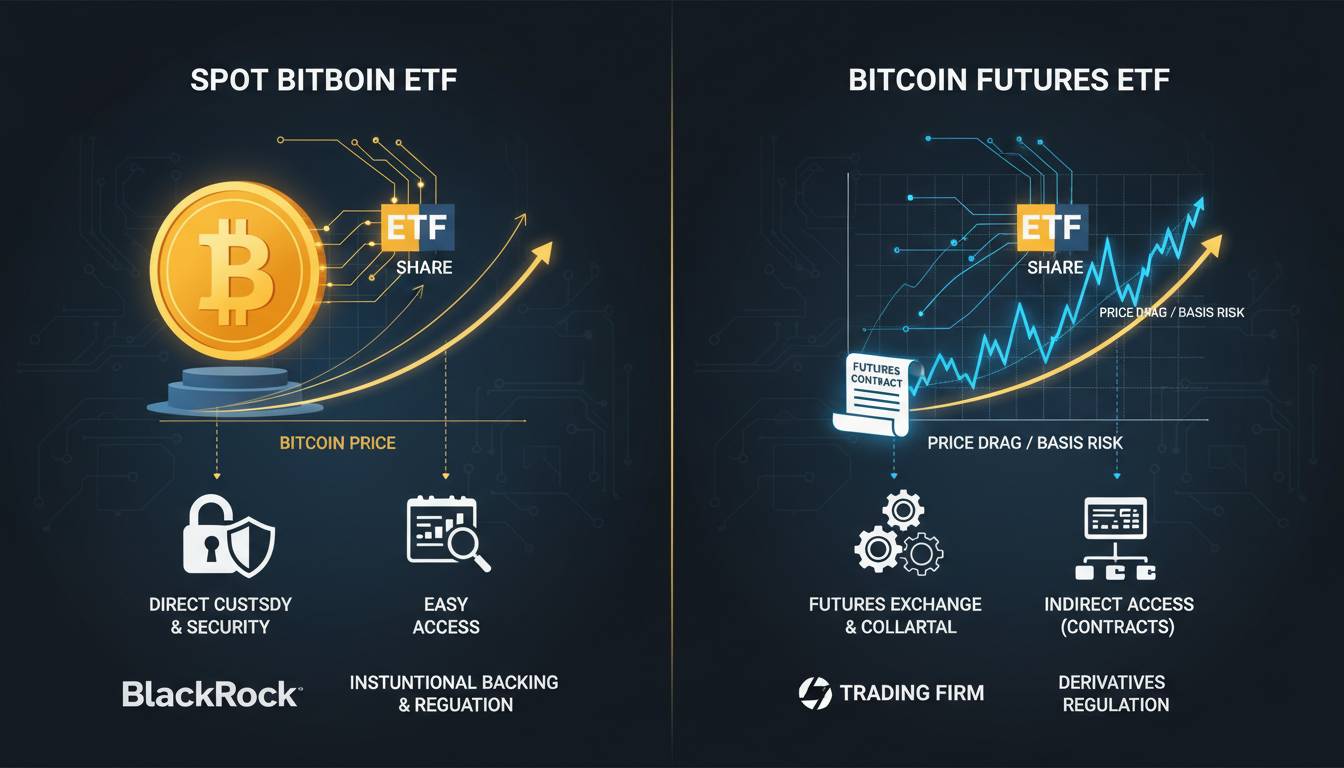
When someone buys a share of a spot Bitcoin ETF like BlackRock’s IBIT or Fidelity’s FBTC, that purchase creates a “flow” into the fund. When someone sells, it creates an “outflow.” The daily net flow is simply inflows minus outflows—a positive number means more money came in than left, a negative number means the opposite.
This sounds straightforward, but here’s where most retail investors get confused: the flow data measures capital movement into and out of the ETFs specifically, not Bitcoin’s broader market dynamics. A $300 million inflow day doesn’t necessarily mean $300 million of new money entered the Bitcoin ecosystem. It means $300 million more flowed into these specific investment products. That distinction matters because the same capital can generate multiple flow events as it moves between different ETF issuers or as institutions rebalance within their Bitcoin allocations.
The data also lags. Most flow numbers are reported with a 24-48 hour delay, meaning you’re seeing yesterday’s or the day-before’s capital movements. In a market that moves fast, this creates a genuine analytical challenge. You’re trying to understand current market sentiment using information that’s already a day old—which is why reading the data in context matters more than fixating on any single day’s number.
The Key Metrics That Actually Move Markets
Every analyst watches three numbers, and the way you interpret them changes depending on what else is happening.
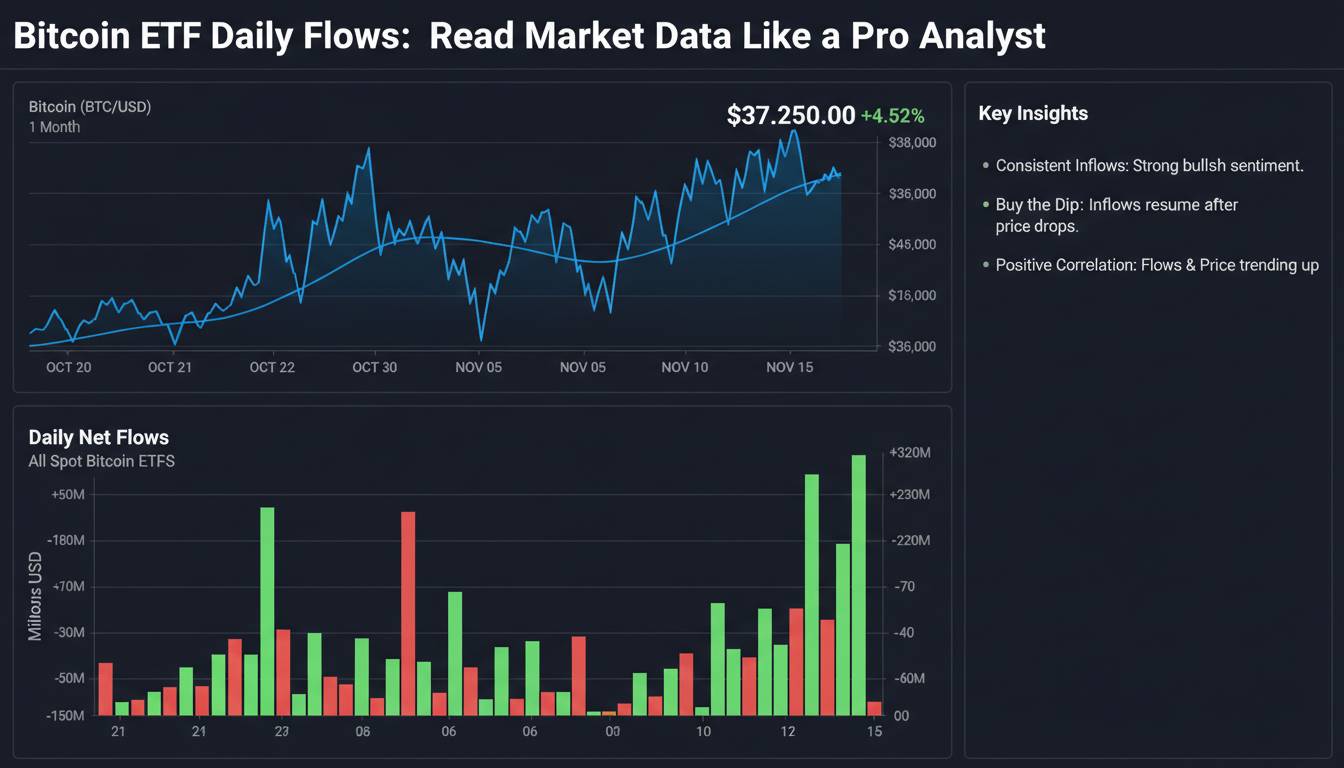
Daily Net Flow is the headline number everyone cites. A positive flow suggests buying pressure; negative suggests selling pressure. But here’s the nuance most articles won’t tell you: single-day flows are noisy. A $400 million inflow might just be one large institutional advisor making a scheduled allocation. What matters more is the trend—and specifically, whether you see sustained inflows over multiple weeks. I typically want to see at least five consecutive positive flow days before I consider it a meaningful signal, and even then, I’m looking at the context.
Cumulative Flows tell the longer story. If you add up all the flows since the ETFs launched, you get a running total that shows the net capital migration into Bitcoin through these products. As of early 2025, cumulative flows remain strongly positive overall—well over $30 billion in net inflows since January 2024—despite periods of outflows. This cumulative number matters because it represents the “anchor” of institutional ownership. Even when daily flows turn negative, this cumulative baseline shows you how much capital is already committed.
Individual Issuer Breakdown is where you find the real information. BlackRock’s IBIT consistently captures 40-60% of daily flows, which makes it essentially a proxy for overall market sentiment. But when you see unusual activity in smaller issuers—say, a significant inflow into ARKB or BTCO—that might signal a specific institutional player making a move. I maintain a spreadsheet tracking each issuer’s share of daily flows, and deviations from their historical patterns often precede or confirm larger market movements.
Where to Find Reliable Flow Data (And Where Not To)
The data itself is free, but the tools you use to analyze it matter enormously.
SoSoValue has become the standard free resource. It aggregates flow data from all spot Bitcoin ETFs and presents it in clean tables with historical comparisons. The site updates daily and includes cumulative totals, individual issuer breakdowns, and historical charts. It’s where I start every morning. The limitation is that it’s manually updated and sometimes has a few hours of lag compared to the actual fund data.
ETF.com and ETF Store both offer more analytical interfaces with flow data, though their Bitcoin-specific coverage varies. Bloomberg terminals provide the fastest real-time data if you have access, but the subscription costs thousands of dollars monthly—worth it only if you’re analyzing flows professionally.
The issuers themselves—BlackRock, Fidelity, Grayscale, Invesco—publish daily flow data on their websites, usually by early afternoon. This is primary source data, meaning it’s the most accurate. The drawback is you’d need to check each issuer separately, which is time-consuming. I only do this when I suspect there’s a discrepancy in the aggregated data.
One thing I’ll push back on: most articles recommend Bloomberg or Reuters for this data. They’re wrong. Those outlets summarize and contextualize the flows, but they don’t provide the raw data in a format you can actually analyze. Go straight to the crypto-native sources for the numbers, then use the financial news sites for interpretation.
How to Interpret Flows in Context
This is where most people fail. They see a number and react to it without understanding what it means relative to other variables. Let me walk through the framework I use.
First, always compare flows to trading volume. A $200 million inflow in a day when Bitcoin ETF volume is $3 billion is very different from the same $200 million when volume is $800 million. The first scenario suggests strong conviction—the flow represents a significant portion of total activity. The second might just be noise. I look for flows that represent at least 5-10% of daily volume as a rough threshold for significance.
Second, consider the price action. Flows and price should generally align over time, but they disconnect in the short term. If flows are positive but Bitcoin price is dropping, that divergence is significant. It suggests selling pressure is coming from non-ETF sources—perhaps miners, long-term holders, or crypto-native investors—while the ETF channel is seeing net buying. That’s actually bullish longer-term because it shows ETF buyers are accumulating despite weakness. Conversely, if price is rising but flows are negative, that’s a warning sign that the rally might lack fundamental support from new capital.
Third, watch for flow extremes. When you see the largest single-day inflow in the ETF’s history, don’t just celebrate—ask why. Usually it means a major institutional player made a large allocation, which is validating. But it can also mean a single entity is “loading up” for a specific reason, and if that entity decides to sell later, the outflow will be equally extreme. I’ve seen both happen.
Fourth, understand the fee structure impact. IBIT charges 0% for its first $5 billion in assets (promotional pricing), while Grayscale’s GBTC charges 1.5%. This fee differential drives flows—investors naturally migrate toward lower-cost options. When you see flows shifting from one issuer to another, check whether fee changes or structural differences explain it before drawing broader conclusions.
Common Mistakes That Will Cost You Money
I watch analysts and retail investors make these errors constantly, and they’re avoidable.
Mistake one: overreacting to single-day data. The most common error. People see a $500 million outflow and declare Bitcoin dead. But in early 2024, GBTC alone had multiple $500+ million outflow days as investors migrated to cheaper alternatives—and Bitcoin still climbed substantially over the following months. Single-day flows are data points, not trends. Build your thesis on patterns, not noise.
Mistake two: ignoring the volume context. A $100 million inflow on a $200 million volume day is huge. The same $100 million on a $2 billion volume day is minor. I can’t stress this enough—never look at flows in isolation. The relationship between flows and volume tells you more than the flow number itself.
Mistake three: conflating inflows with ownership. Here’s an uncomfortable truth: inflows don’t always mean net new ownership of Bitcoin. Some of the capital coming into ETFs is being rotated from other Bitcoin products—primarily GBTC after its conversion, but also from crypto-native funds and even from direct Bitcoin holdings. When you see a massive inflow day, a meaningful portion might just be internal reallocation rather than new money entering the asset class.
Mistake four: missing the flow direction of individual issuers. I mentioned this earlier but it’s worth emphasizing: aggregate flow data obscures what’s happening at the issuer level. When everyone focuses on the headline net number, they miss that IBIT might be seeing strong inflows while three other issuers are bleeding. That issuer-specific data often predicts where the market is heading before the aggregate does.
FAQ: What People Actually Ask About Flows
What does daily Bitcoin ETF flow mean?
Daily Bitcoin ETF flow represents the net amount of capital moving into or out of spot Bitcoin ETFs on a given trading day. Positive flows indicate net buying; negative flows indicate net selling. These figures aggregate activity across all spot Bitcoin ETF issuers and serve as a proxy for institutional and semi-institutional demand for Bitcoin exposure.
Where can I find real-time Bitcoin ETF flow data?
Real-time data isn’t freely available. Official flows are typically reported with a one-day delay. SoSoValue aggregates daily flows from all issuers and updates by early morning EST. Individual ETF issuers publish flows on their websites, usually by early afternoon. Professional Bloomberg terminals offer the fastest data but require paid subscriptions.
Why do Bitcoin ETF flows matter?
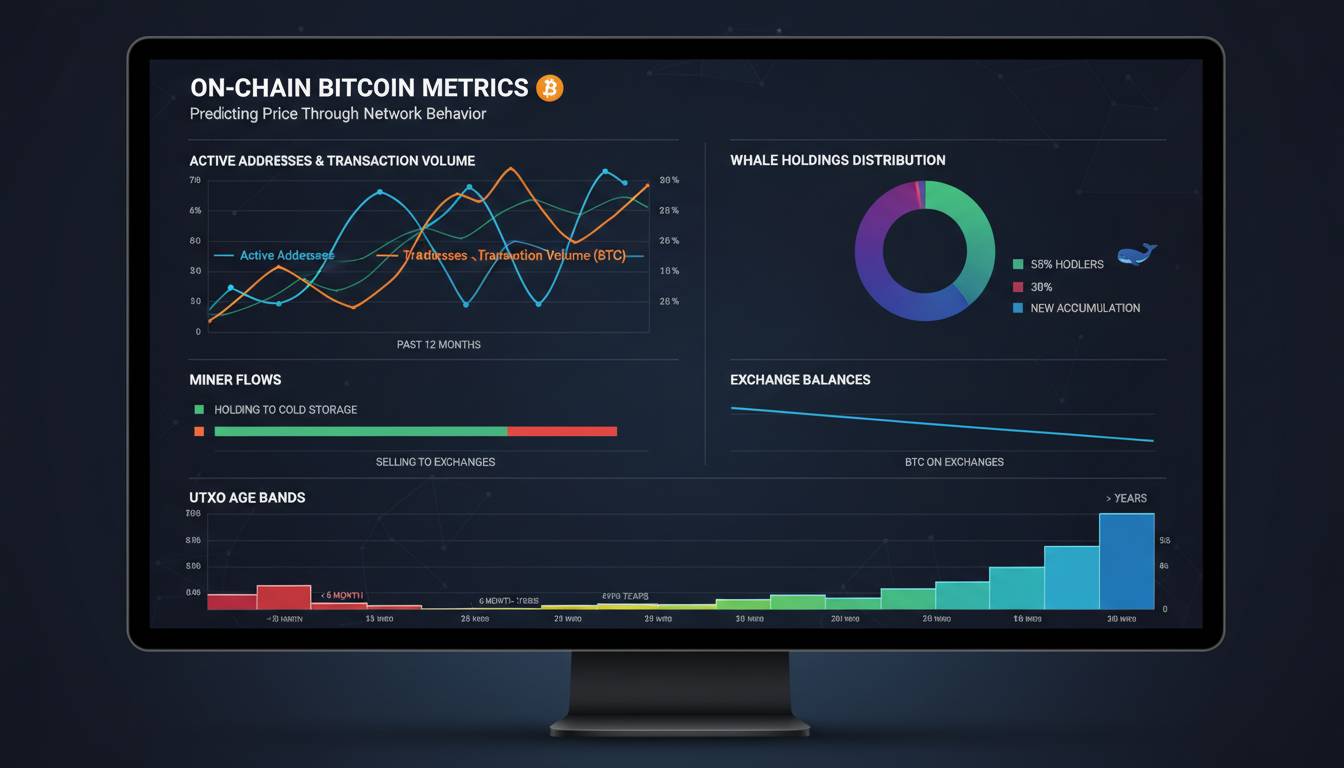
ETF flows matter because they represent real, regulated capital entering the Bitcoin market through products that institutions can hold in their portfolios. Unlike on-chain metrics, which can be gamed, ETF flows come from brokerage accounts and custodians—the same channels used for traditional securities. This makes them a more reliable signal of “smart money” sentiment than social media activity or retail trading volumes.
What is a good Bitcoin ETF inflow figure?
There’s no single “good” number. It depends on the context. As a rough benchmark, daily net inflows above $200-300 million on regular volume days suggest strong institutional conviction. However, what matters more is the trend: sustained positive flows over weeks matter more than any single large number. Contextualize every flow figure against recent trading volume and Bitcoin’s price action.
Looking Forward: What the Data Can’t Tell You
If you’ve read this far, you now have a genuine analytical framework for reading Bitcoin ETF flows. You know what the metrics measure, where to find the data, how to interpret them in context, and what mistakes to avoid.
But here’s what I want you to hold onto: the flow data is a powerful tool, and it’s not infinite in its utility. It tells you where capital is moving, but not why. It shows you the aggregate behavior of ETF investors, but it doesn’t capture the entire Bitcoin market—on-chain activity, futures positioning, and global exchange flows all move independently. The best analysts use ETF flows as one input among many, not as a standalone crystal ball.
The other reality is that as Bitcoin ETFs mature, their flows will normalize. The extraordinary $1+ billion inflow days of early 2024 were extraordinary precisely because they represented the initial wave of institutional adoption. As the market reaches saturation—more Bitcoin held through ETFs, less available to move—the absolute flow numbers will likely shrink relative to the total assets under management. This doesn’t mean Bitcoin is losing institutional support. It means the market is maturing.
Your job as an analyst isn’t to find the perfect signal. It’s to assemble multiple imperfect signals into a coherent thesis. The ETF flows are now one of those signals, and they’re more reliable than most of what you’ll find in crypto markets. Use them accordingly.