If you’re asking whether to buy Bitcoin right now, you’ve already missed the most important question. The real issue isn’t whether now is the right moment — it’s whether you understand where we are in the cycle and what historical patterns have actually revealed about timing. I’ve spent years tracking these markets, and the data tells a more nuanced story than the “HODL or FOMO” narrative that dominates crypto Twitter. Past cycles don’t repeat exactly, but they rhyme in ways that every serious investor should understand before committing capital.
This isn’t about predicting prices with crystal-ball certainty. It’s about examining what the historical record — the actual numbers from three complete market cycles — has shown about when buyers who entered during different phases experienced their best outcomes. There’s actionable intelligence in that data, and there’s also a warning: some conventional wisdom about timing is simply wrong.
What Actually Defines a Bitcoin Market Cycle
Before diving into the numbers, we need clarity on what constitutes a cycle in this market. A Bitcoin cycle isn’t arbitrary — it’s structured around two primary events: the halving, which cuts the new supply issuance by half roughly every four years, and the subsequent parabolic moves that follow. The cycle peaks when mania hits retail, then collapses into multi-year bear markets that shake out everyone who bought at the top.
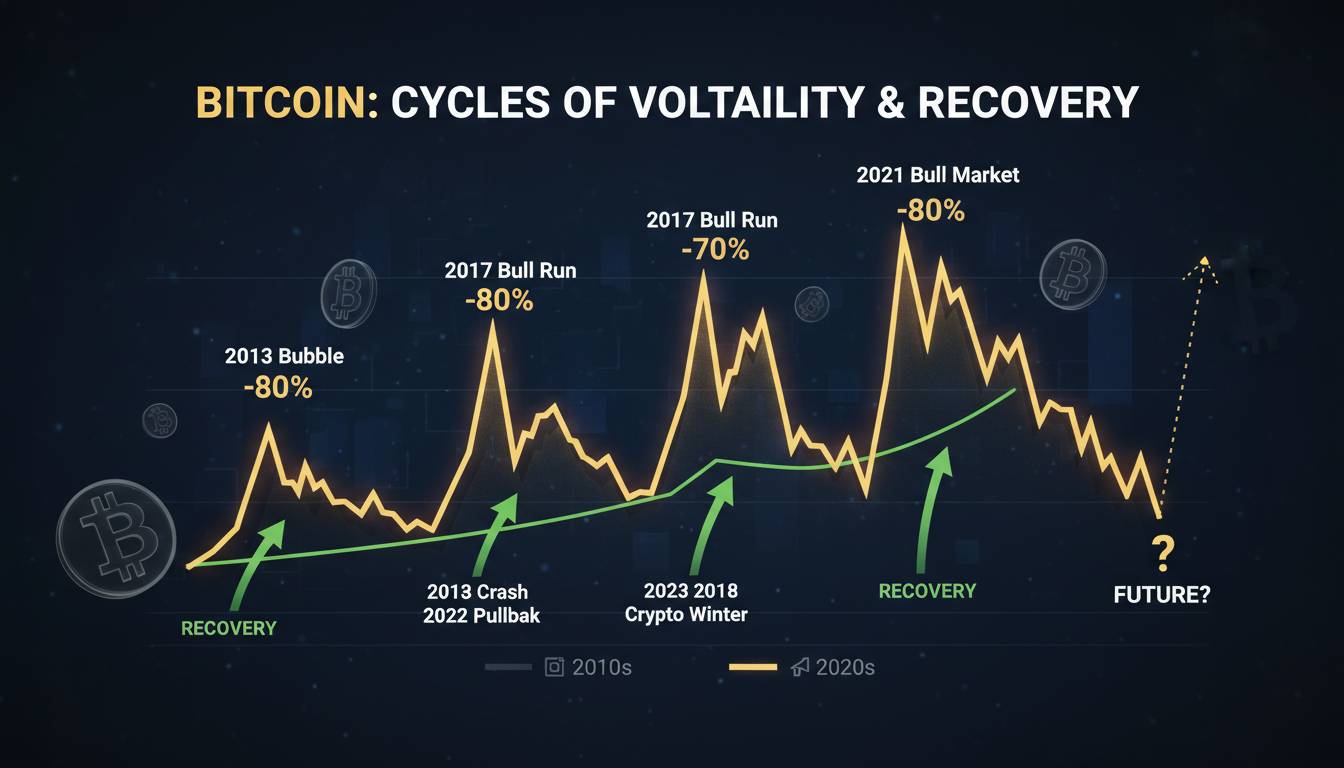
The three major cycles we can analyze with clean data are the 2013 cycle, the 2017 cycle, and the 2021 cycle. Each had distinct characteristics, but each also followed a remarkably similar arc from halving to peak to crash. Understanding this template is the foundation for interpreting what the data actually says about timing your entry.
Most importantly, the market doesn’t care about your cost basis. It moves on adoption, sentiment, and liquidity — factors that operate on multi-year timescales regardless of when you personally deploy capital. The question “should I buy now or wait” only makes sense when framed against where we are in this larger structural pattern.
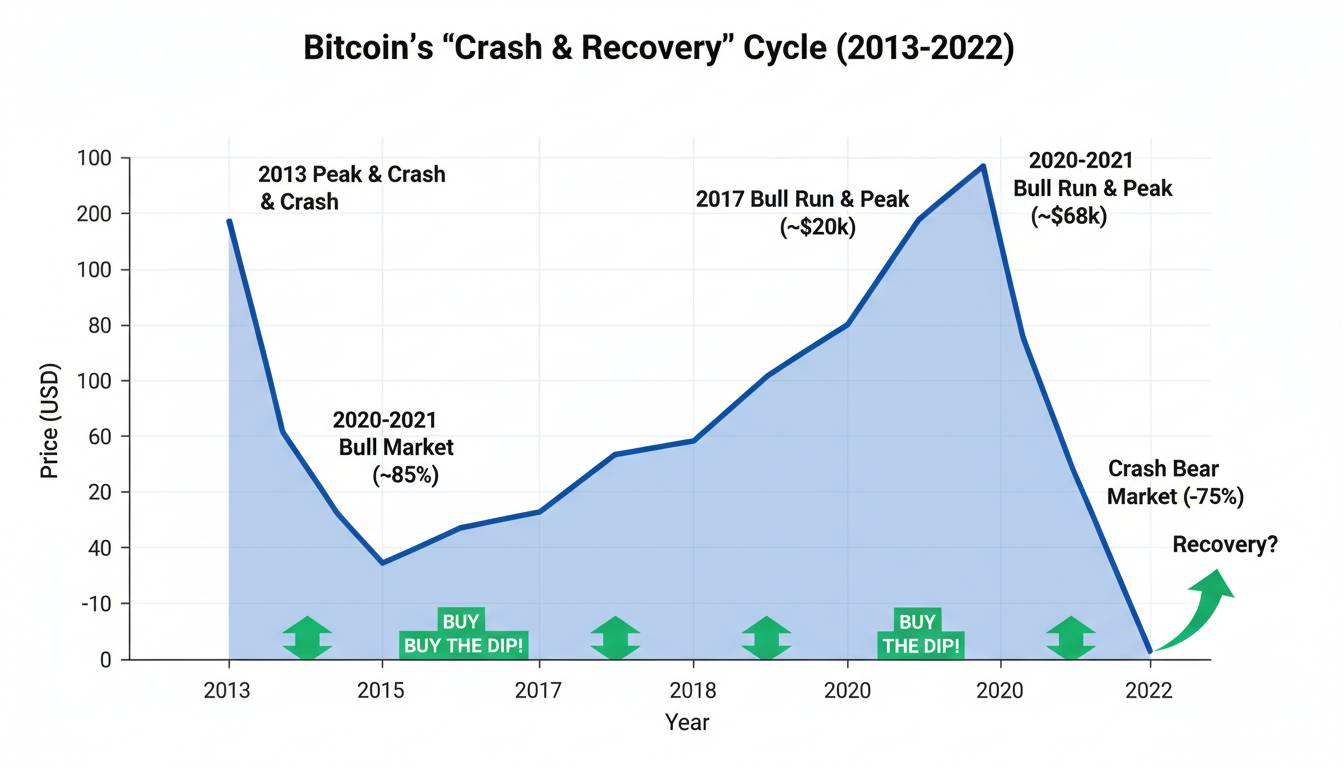
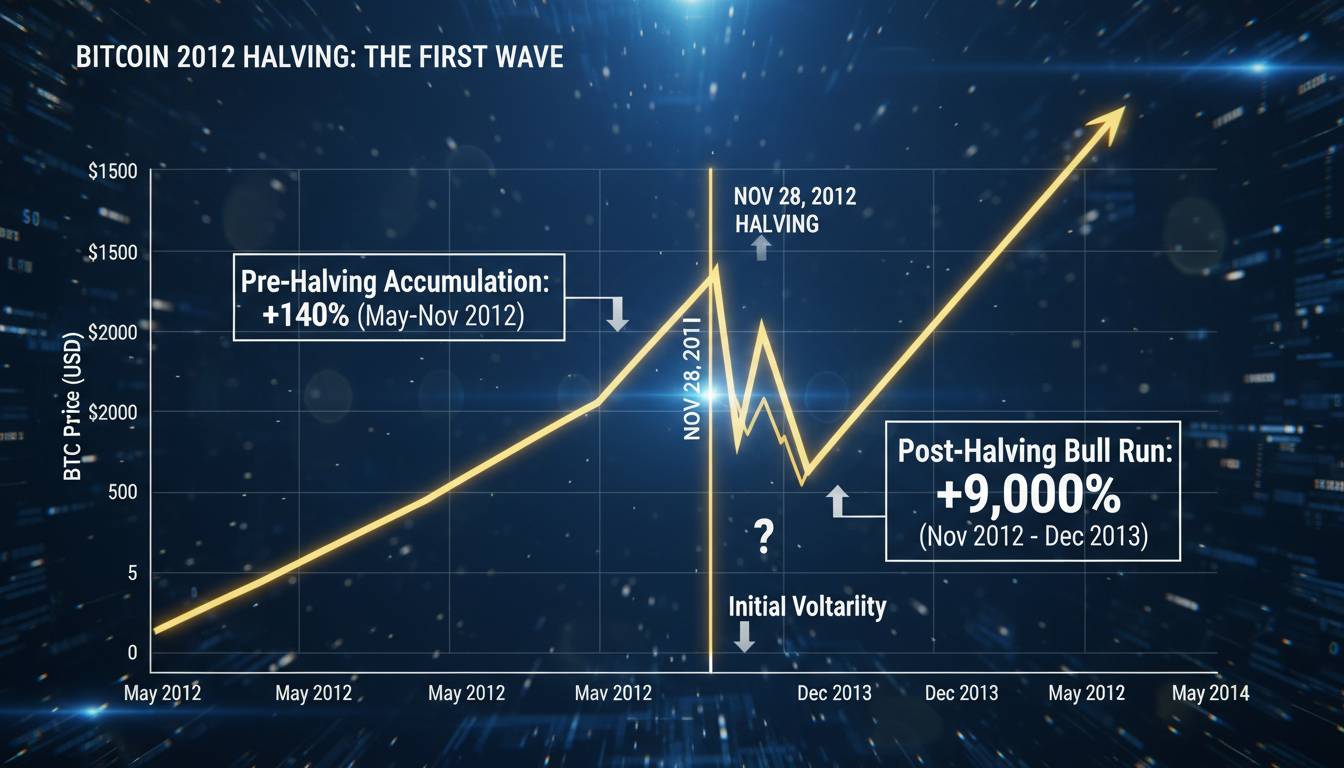
The 2013 Cycle: The First Real Test
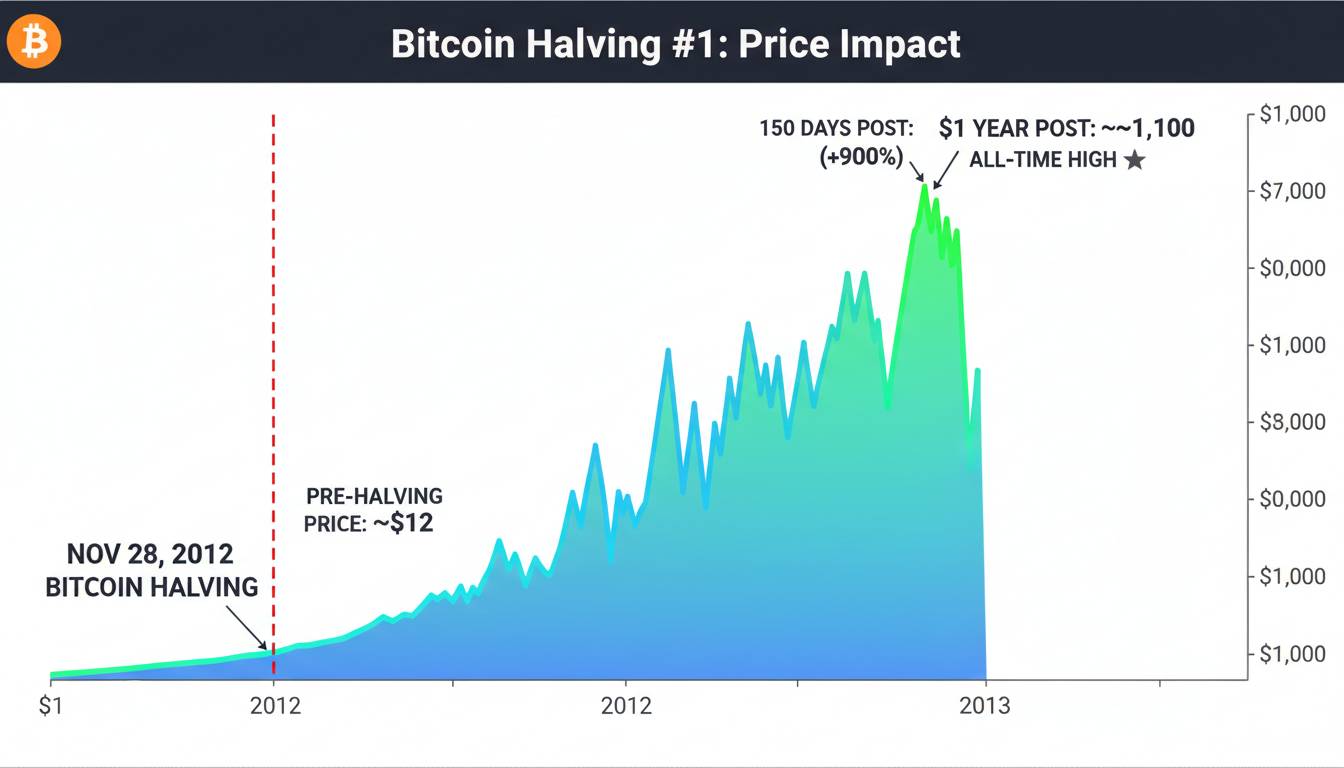
The 2013 cycle holds special significance because it was the first to follow Bitcoin’s first two halvings and demonstrate the pattern that would repeat in subsequent cycles. After the November 2012 halving, Bitcoin began a grinding ascent that accelerated throughout 2013, ultimately reaching approximately $1,100 in late November — a gain of over 8,000% from the cycle lows.
The data shows: an investor who bought at the absolute peak in December 2013 would have waited nearly three years to break even, as Bitcoin crashed to around $200 by early 2015. That’s a brutal holding period, and it’s the reason cycle timing matters. But an investor who bought during the correction — say, in the spring of 2013 when Bitcoin was trading around $50 — would have seen returns that dwarfed any traditional asset class even after the subsequent crash.
The key insight from 2013 isn’t that buying at any point works out eventually. It’s that buying during the fear phase after the initial post-halving rally, rather than during the mania peak, produced dramatically different outcomes. The cycle bottom in early 2015 wasn’t obvious at the time — there were plenty of voices declaring Bitcoin dead — but the data clearly shows it represented a generational buying opportunity.
The 2017 Cycle: Mainstream Arrival
The 2017 cycle brought Bitcoin to mainstream consciousness in a way the 2013 cycle never did. After the July 2016 halving, Bitcoin began a slow grind higher that accelerated dramatically in the second half of 2017, ultimately reaching nearly $20,000 in mid-December of that year. The parabolic move in the final quarter of 2017 was unlike anything previous cycles had seen — retail FOMO reached genuine hysteria levels, with late-cycle buyers deploying capital at exactly the worst moment.
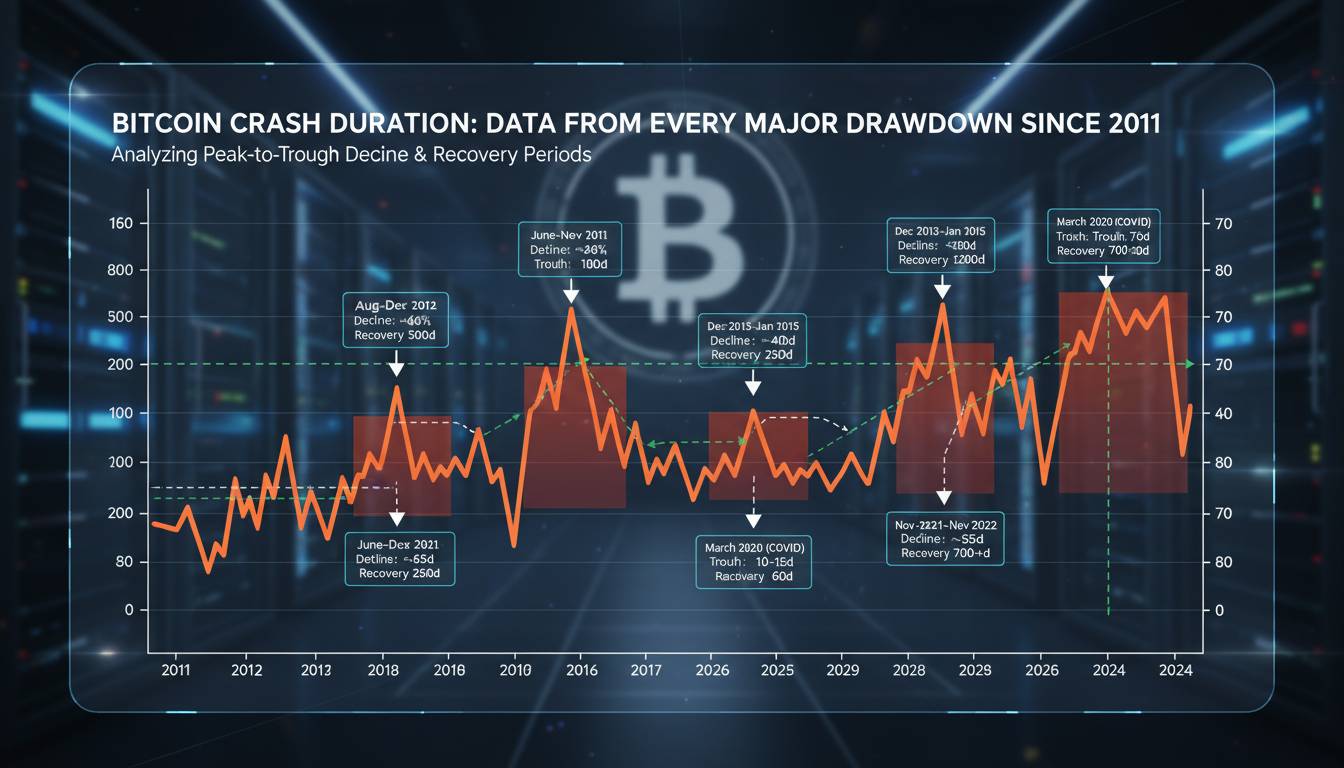
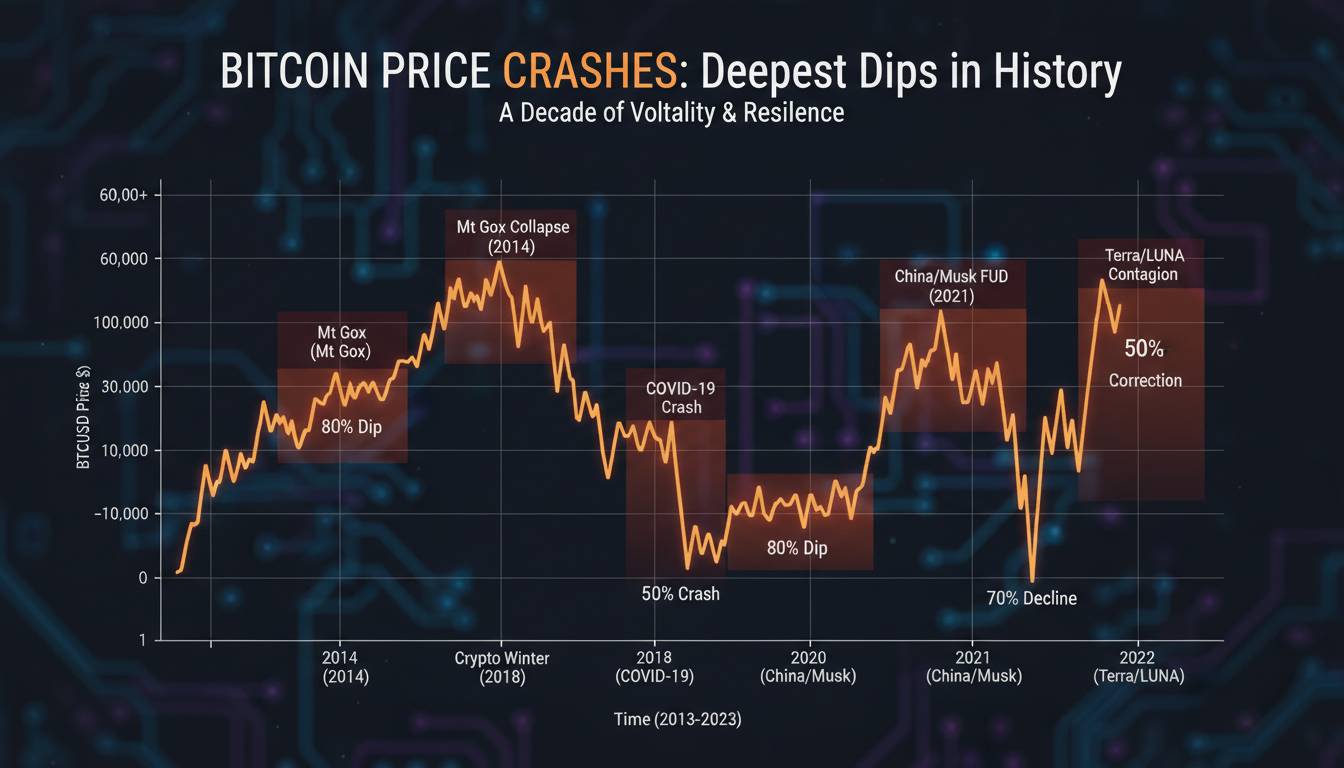
The data from this cycle is particularly instructive because it showed how quickly the market can reverse. Bitcoin lost approximately 80% of its value from the December 2017 peak, bottoming around $3,200 in December 2018. Anyone who bought within three months of the peak experienced losses exceeding 70%, and many abandoned their positions during the extended bear market that followed.
But here’s the counterintuitive point that many articles on this topic gloss over: the 2017 cycle had its best risk-adjusted buying opportunities not at the bottom in late 2018, but during the period from roughly April to June 2017, when Bitcoin was consolidating in the $1,000-$2,000 range after its initial post-halving run. The subsequent gains from those levels to the peak were extraordinary, and the downside risk was manageable compared to buying at the top or trying to catch a falling knife at the bottom.
This is the trap that timing-focused investors consistently fall into: waiting for the bottom means competing with every other buyer who’s watching the same charts, and by the time the bottom is unambiguously confirmed, a significant portion of the recovery has already occurred.
The 2021 Cycle: The Most Recent Complete Data
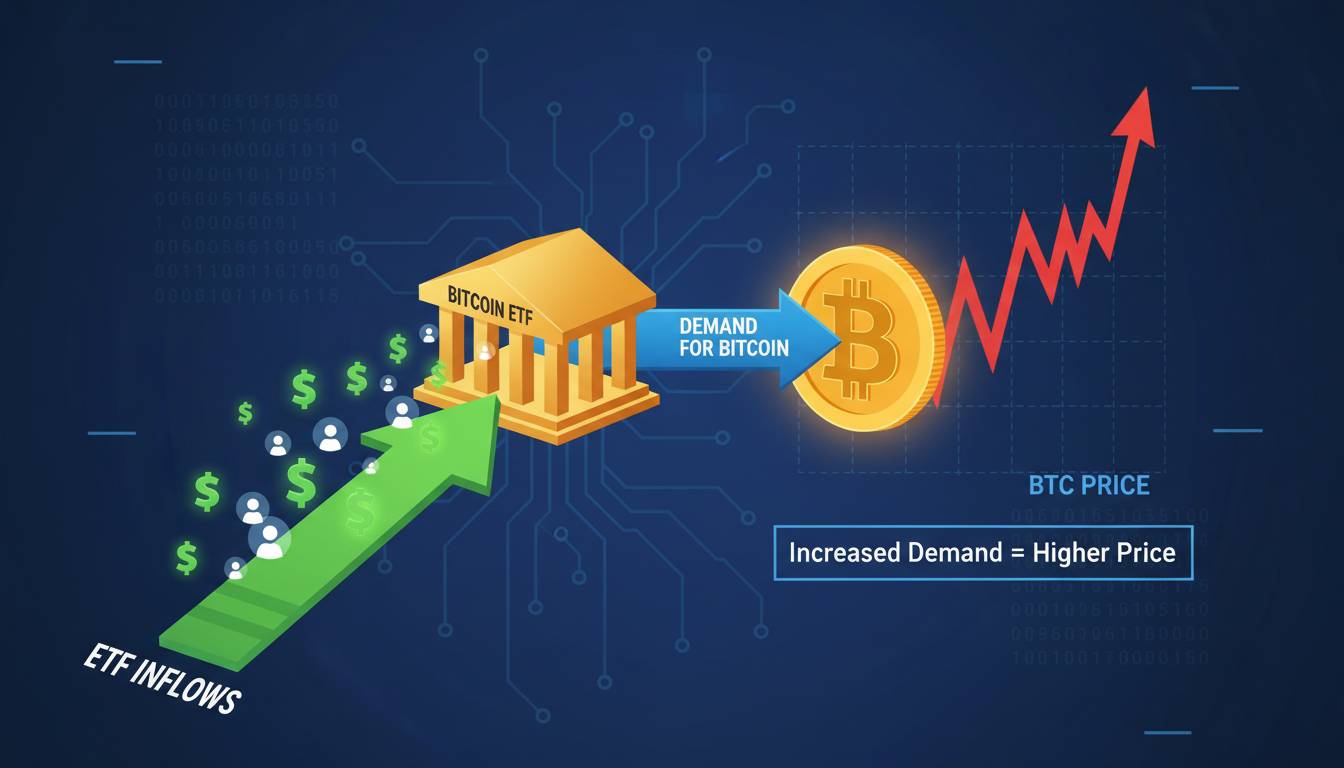
The 2021 cycle is the most relevant to current decision-making because it’s the most recent complete cycle we have data for, and it included dynamics that will likely repeat in future cycles. Bitcoin reached its cycle peak of approximately $69,000 in November 2021, following the May 2020 halving. The run-up was fueled by massive institutional adoption, with corporate treasuries adding Bitcoin to balance sheets and futures-based ETFs launching.
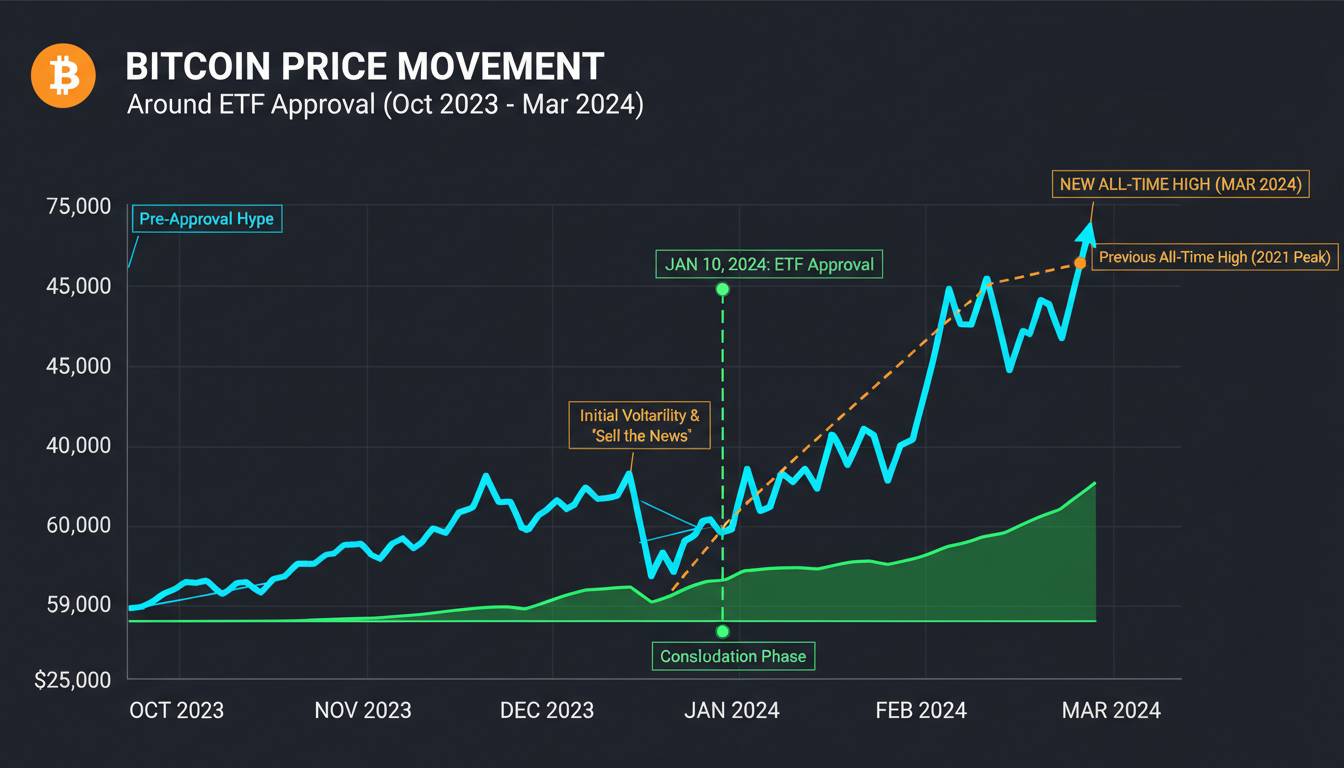
The crash from that peak was severe — Bitcoin lost approximately 77% of its value, falling to roughly $16,000 by late 2022. The subsequent recovery has been uneven, with Bitcoin regaining the $60,000 level in early 2024 before the halving event in April 2024.
What makes the 2021 cycle particularly instructive is that it demonstrated how difficult it is to time entries even when you understand the cycle structure. Many sophisticated investors who “successfully” avoided buying at the top also failed to buy at the bottom, sitting on cash through the 2022 crash waiting for further declines that never came in quite the way they expected. The data shows that perfect timing is functionally impossible for most participants — the market doesn’t cooperate with your models.
What the Halving Data Actually Shows
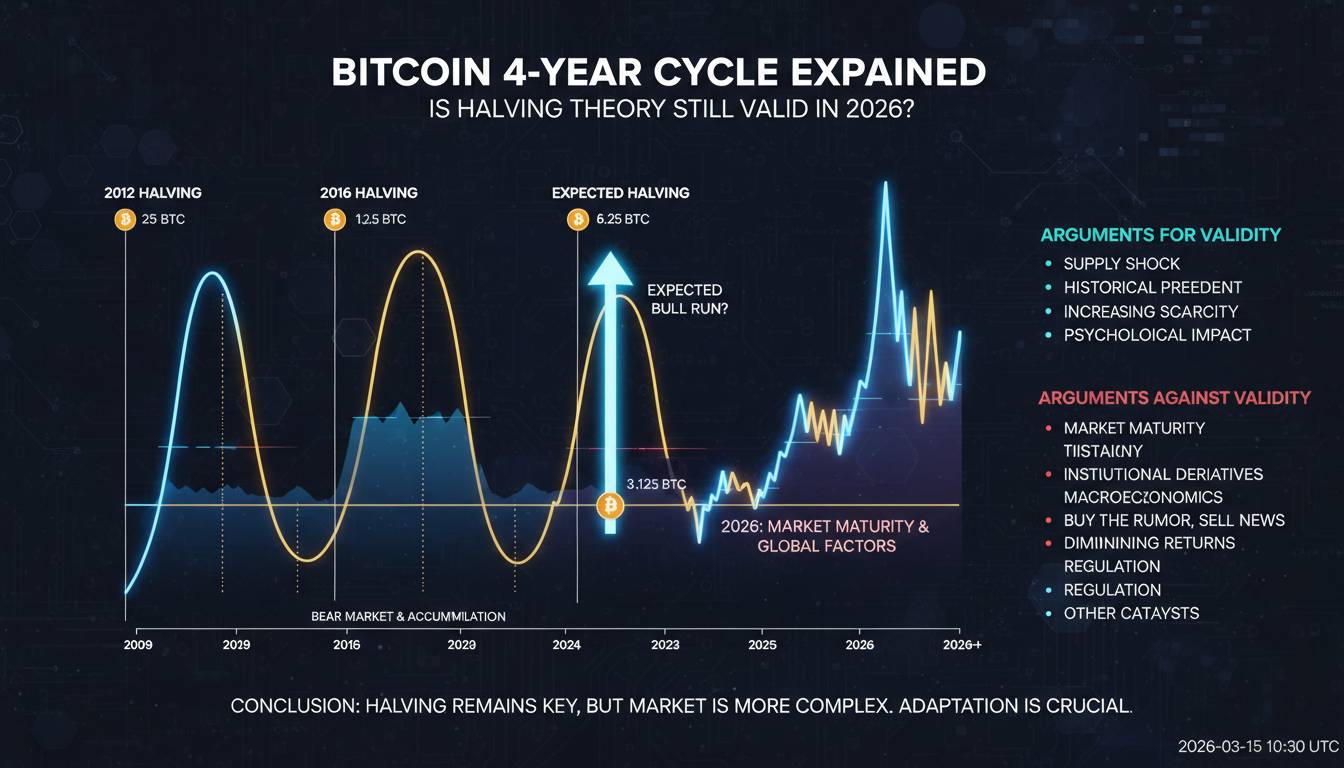
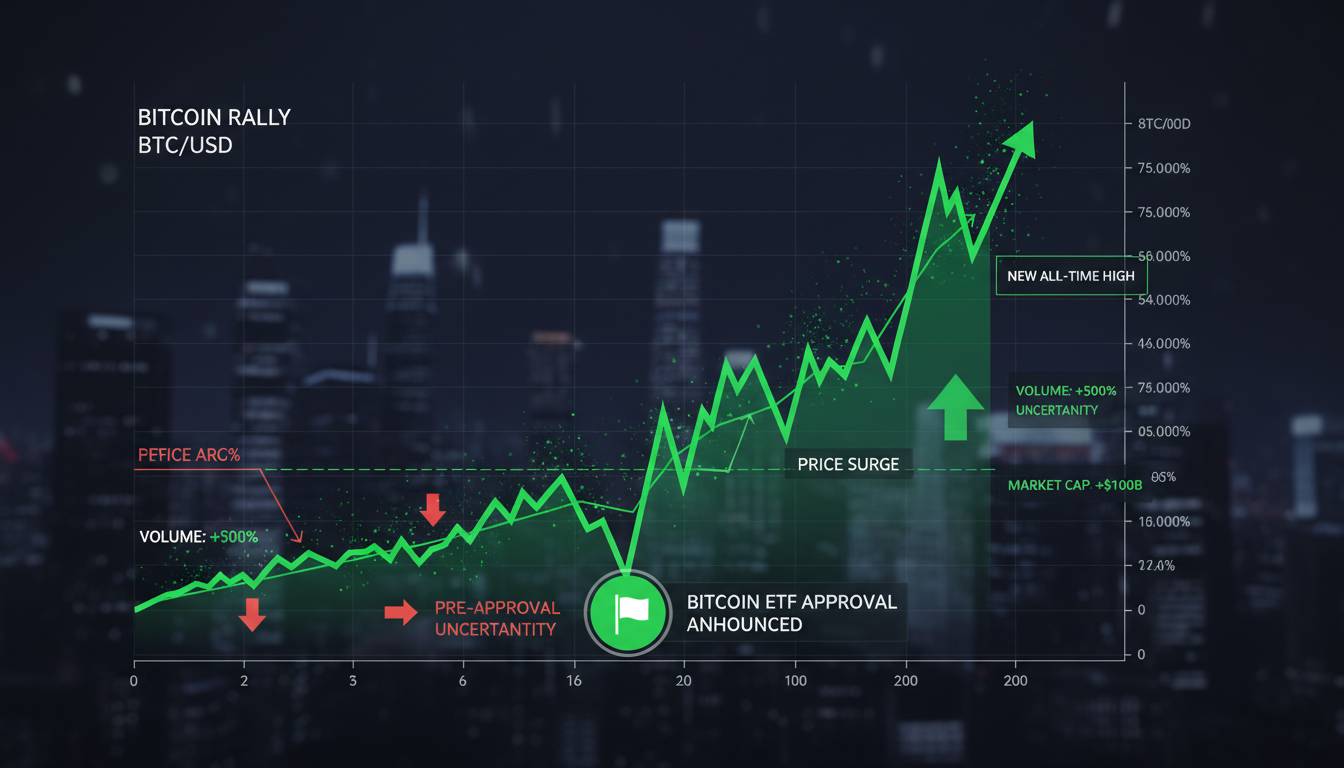
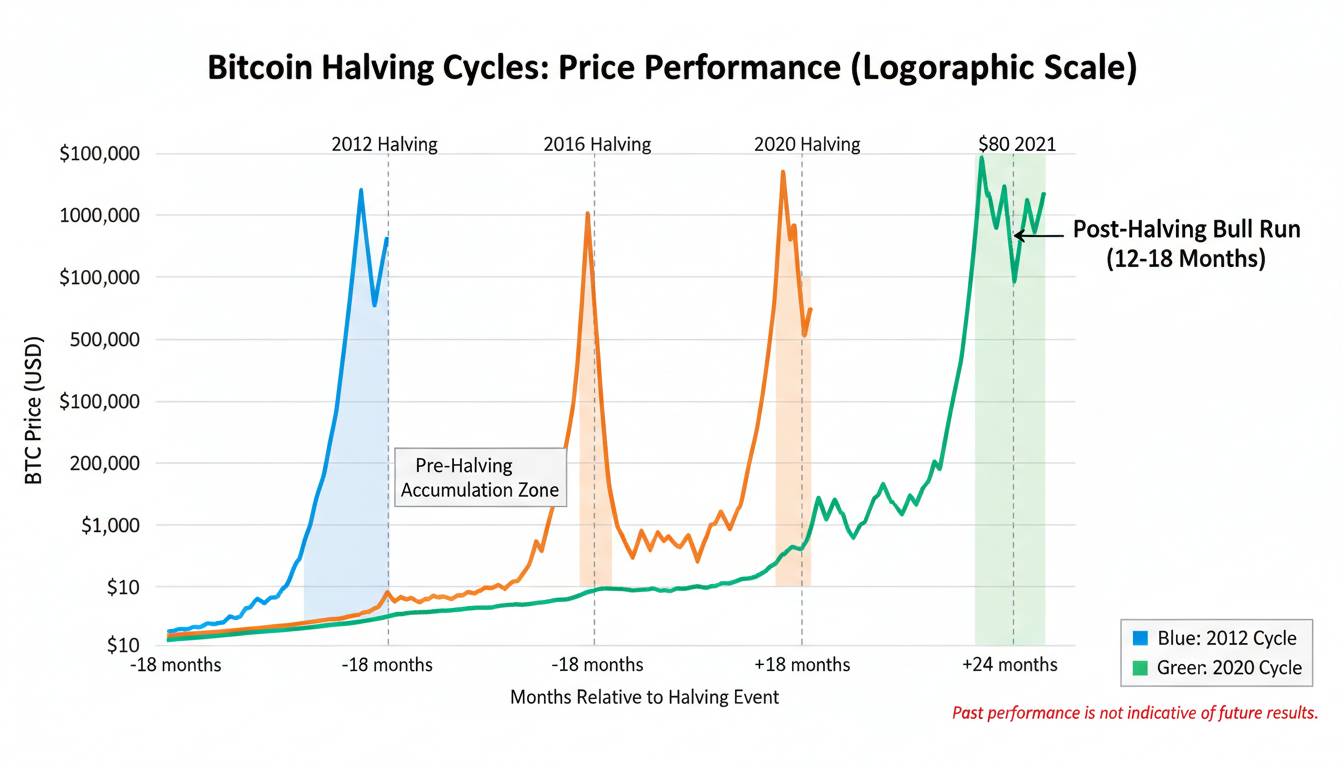
The halving is the most frequently cited framework for cycle timing, and it’s worth examining what the data actually demonstrates rather than what popular narratives claim. The four halvings we’ve experienced (2012, 2016, 2020, and 2024) have each been followed by new all-time highs, but the timeframes and magnitudes have varied significantly.
After the 2012 halving, the all-time high came approximately 12 months later. After 2016, it took roughly 24 months. After 2020, the peak arrived about 18 months later. The pattern isn’t linear, and the “halving to the moon” narrative that dominates social media isn’t supported by the historical data when you look at the actual timeframes.
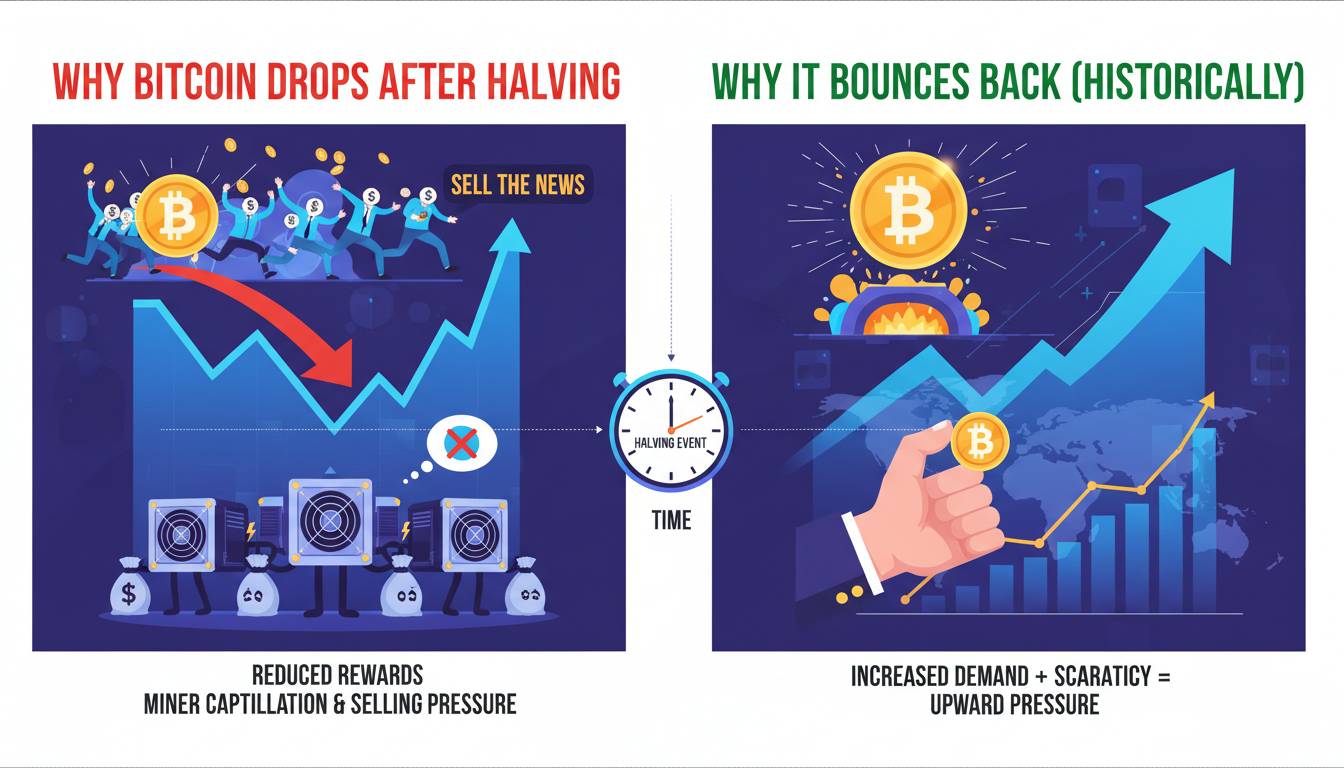
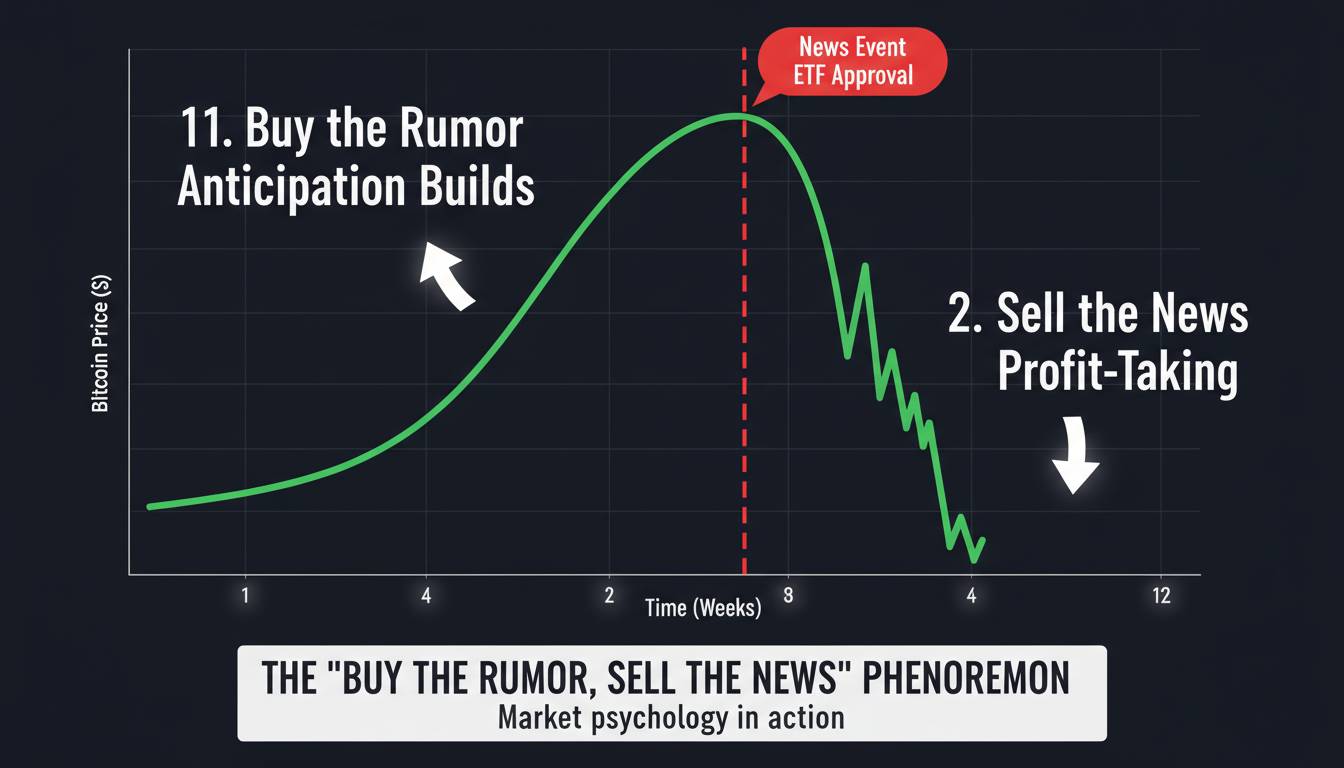
More importantly, the halving is a supply-side event that gets priced in well before it occurs. Bitcoin’s price typically appreciates in the 12-18 months leading up to the halving, as traders anticipate the reduced issuance. This means buying immediately after a halving — the timing that most “halving play” content recommends — often catches you at a local high rather than the beginning of the move.
If you’re using halving cycles as your timing framework, the data suggests the period 6-12 months before the halving has historically offered better risk-adjusted entry points than the post-halving period. This contradicts the mainstream narrative, but it’s what the actual price action shows.
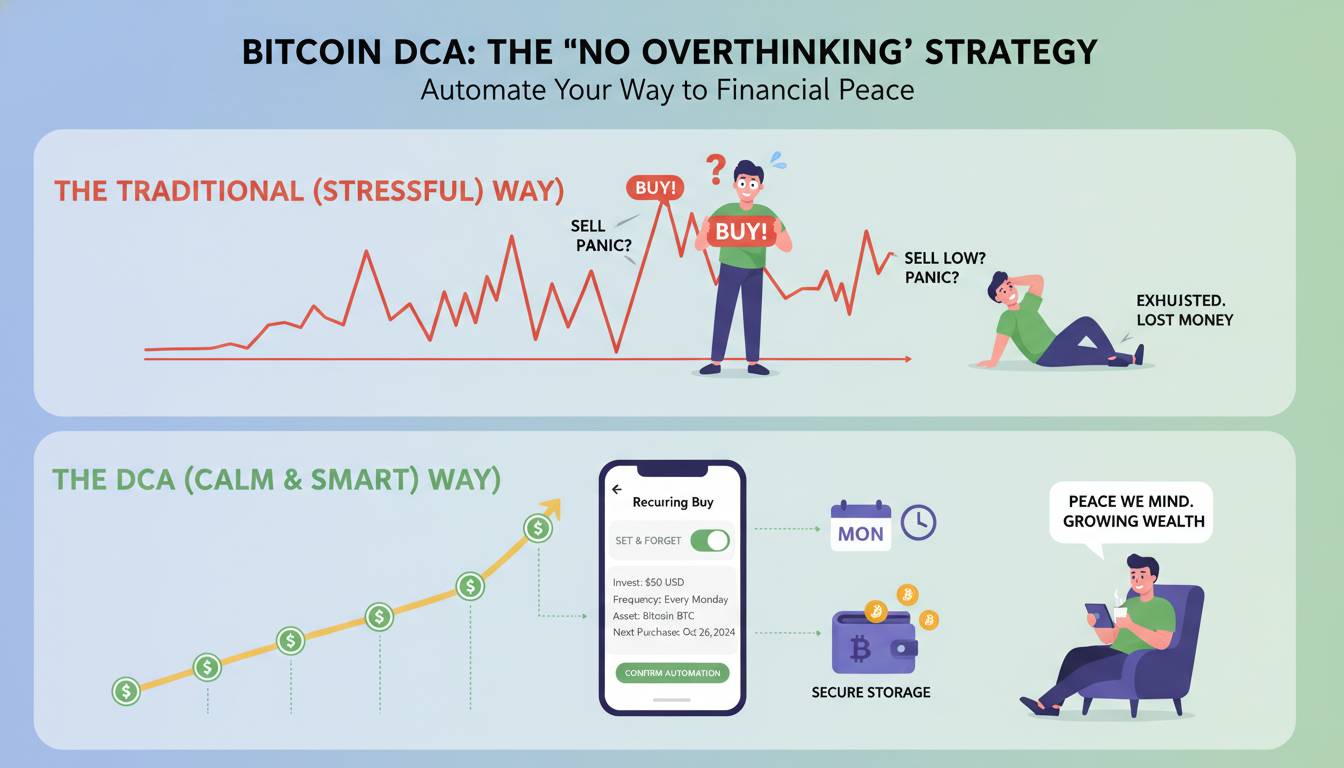
The Counterintuitive Truth About Dollar-Cost Averaging
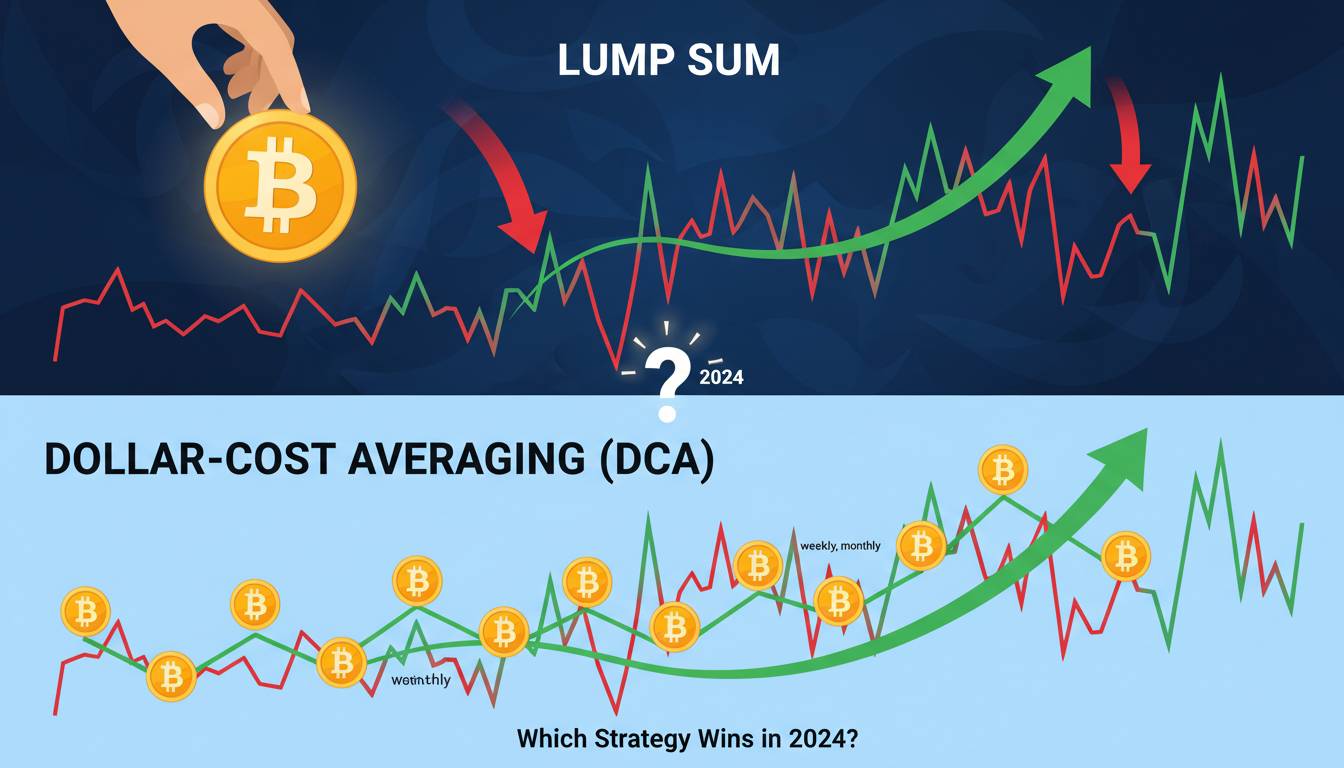
Here’s where I need to push back against advice that’s considered conventional in crypto circles: dollar-cost averaging (DCA) into Bitcoin is often presented as the obviously correct strategy for most investors, and it’s not that simple. The data from past cycles shows that DCA underperforms lump-sum investing in bull markets but dramatically outperforms in bear markets — which means the strategy you choose depends entirely on where you believe we are in the cycle.
An investor who DCA’d $500 monthly from January 2017 through December 2017 (the peak period) would have an average cost basis around $8,000 and would still be underwater when Bitcoin crashed below $4,000. Meanwhile, a lump-sum buyer who deployed that same capital in January 2019 at $3,500 would be substantially ahead by late 2020. The difference isn’t trivial — it’s the difference between gains measured in percentages versus losses measured in years of waiting.
This doesn’t mean DCA is always wrong. It means DCA makes sense when you’re entering during a bear market or early in the cycle, not when you’re entering during a parabolic advance. Most retail investors, unfortunately, discover Bitcoin during bull markets when DCA is at its worst, then get discouraged when the strategy underperforms precisely when they’re most likely to try it.
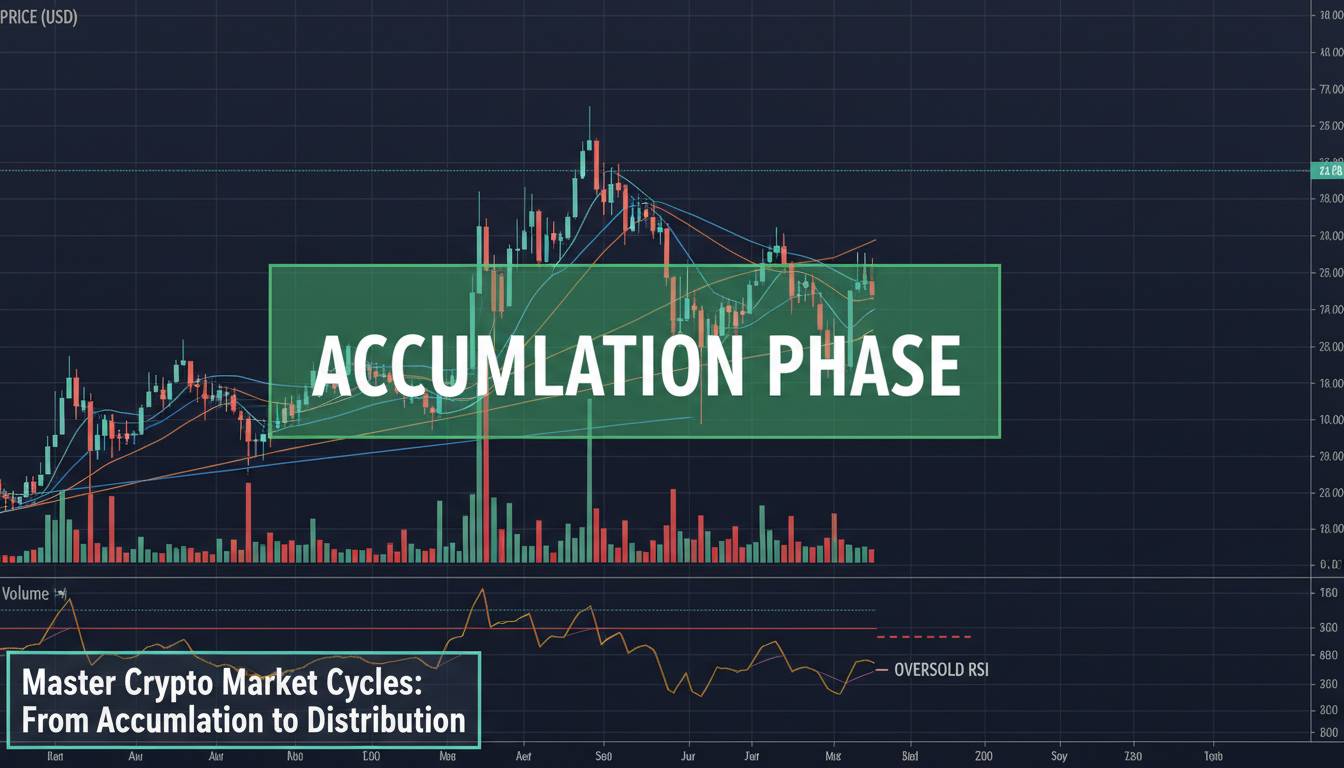
Pattern Recognition and What Breaks the Mold
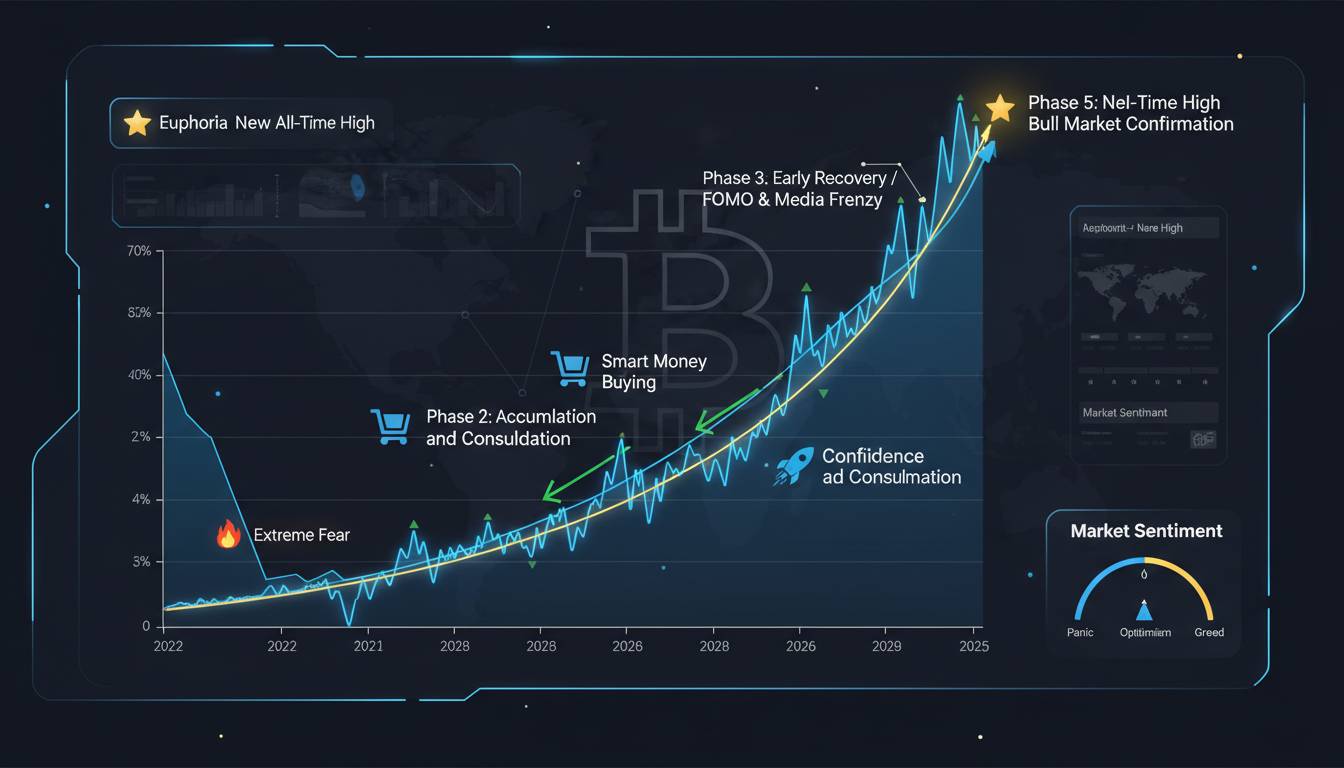
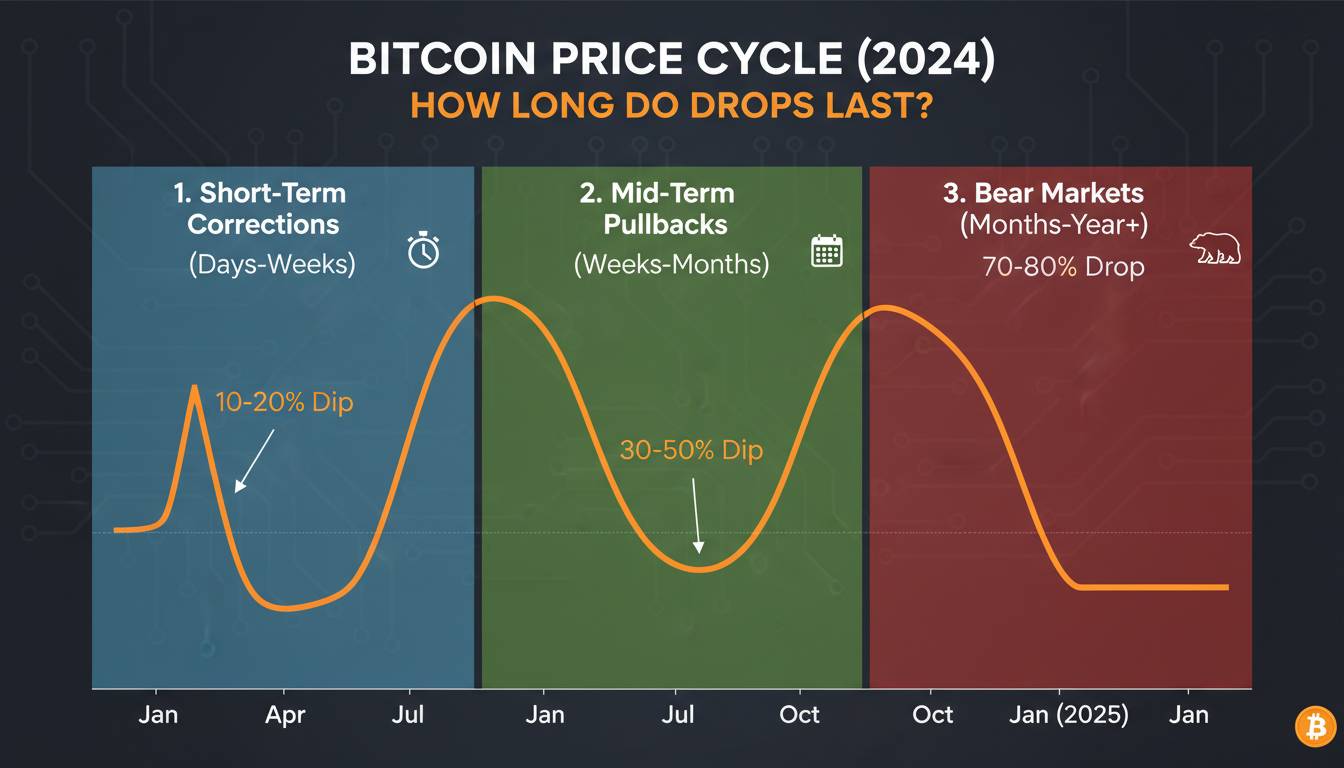
Looking across all three complete cycles, certain patterns emerge consistently. The period of deepest fear, typically 12-18 months after the cycle peak, has historically represented the best buying opportunity — but it’s also the period when the fewest people are willing to buy. The media narrative shifts from “Bitcoin to the moon” to “Bitcoin is dead,” and the overwhelming sentiment among observers is that this time is different, that the previous cycles won’t repeat.
The problem is that this consensus is both right and wrong. It’s right that each cycle has unique characteristics driven by different adoption phases and macroeconomic conditions. It’s wrong in assuming that the fundamental dynamics — parabolic advance followed by collapse followed by multi-year recovery — won’t recur.
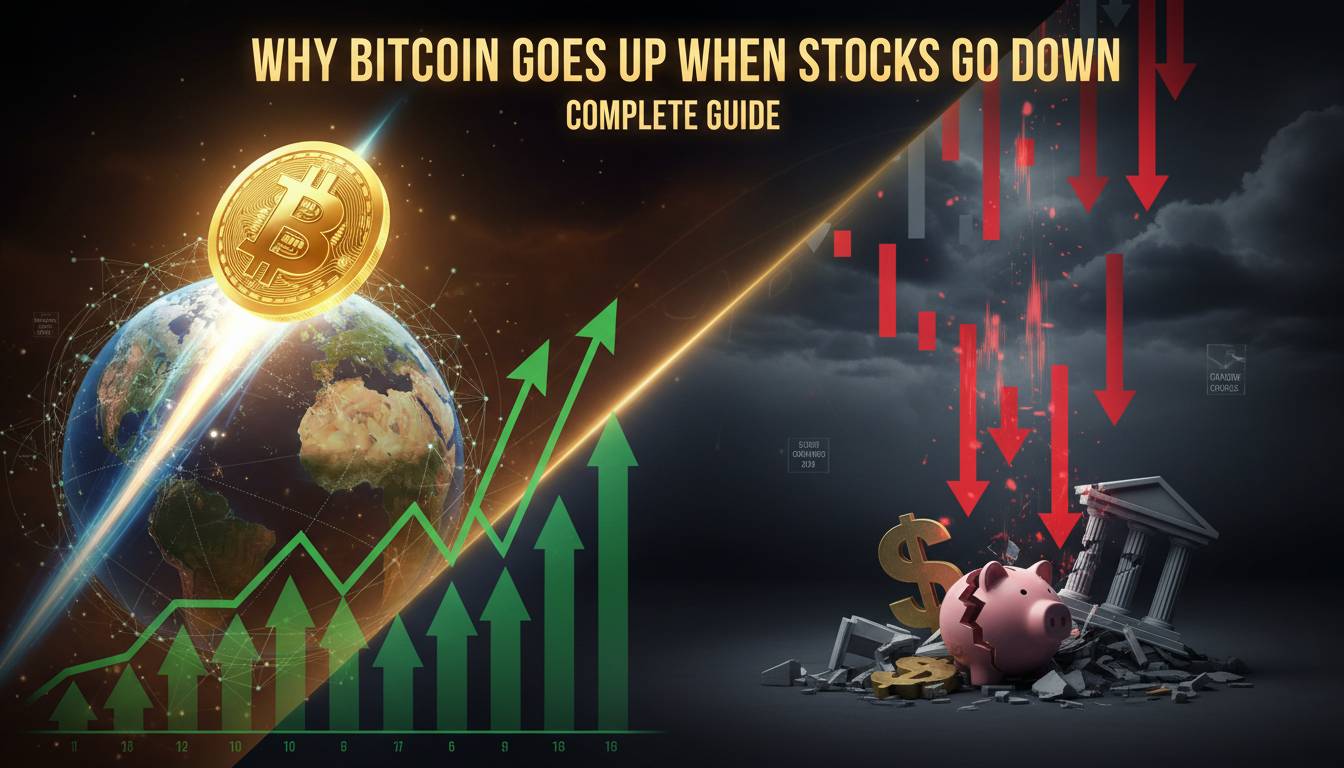
What breaks the mold is institutional involvement. The 2021 cycle was the first to feature significant corporate and institutional capital, and this changed dynamics in ways we’re still understanding. The correlation between Bitcoin and traditional risk assets increased, meaning Bitcoin no longer moves in its own isolated universe. Macroeconomic factors — interest rates, liquidity conditions, Federal Reserve policy — now influence Bitcoin price action in ways they didn’t in earlier cycles.
If you’re timing your entry based solely on historical cycle patterns without accounting for these new variables, you’re working with an incomplete framework. The data from past cycles is essential, but it’s not sufficient for current decision-making.
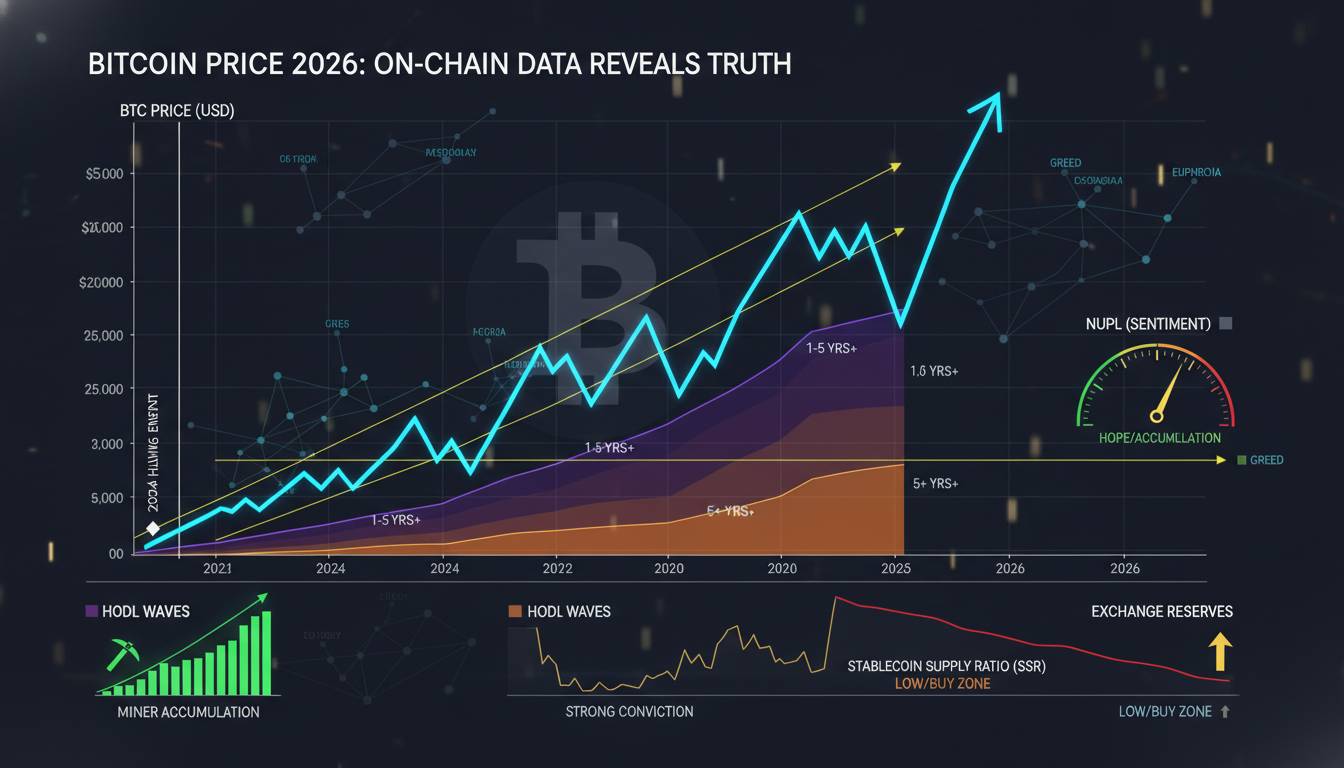
Where We Are Now and What the Data Suggests
As of early 2025, we’re approximately nine months past the April 2024 halving, and Bitcoin has experienced significant appreciation since the cycle lows in late 2022. The data from previous cycles would suggest we’re in the expansion phase, with the most dramatic price appreciation potentially still ahead if historical patterns hold.
But here’s the honest caveat: the data from past cycles describes what happened, not what will happen. The sample size is small — three complete cycles — and each cycle has occurred in fundamentally different market environments. Applying historical patterns to current conditions requires humility about the limitations of the data.
What the historical data does suggest, with reasonable confidence, is that buying during periods of extreme fear tends to produce better outcomes than buying during periods of extreme greed. It suggests that the best entry points historically occur when the mainstream narrative has shifted to maximum pessimism. And it suggests that patience matters more than perfect timing — the investors who have done best over multi-year horizons are those who bought during earlier cycles and held through the volatility, regardless of their specific entry timing.
Moving Forward With Clear Eyes
The question “should I buy Bitcoin now or wait” doesn’t have a universal answer. The data from past cycles reveals that timing matters enormously for short-term returns but matters less for long-term holders who can withstand the drawdowns. If you’re evaluating an entry point, the most useful framework isn’t trying to predict the bottom — it’s understanding where we are in the cycle structure and whether you’re comfortable with the volatility that any entry point will entail.
The historical record also reveals that the investors who do best aren’t those who time everything perfectly. They’re those who understand the asymmetric payoff structure — the possibility of significant downside in the short term but substantial upside over longer periods — and position accordingly. If you’re waiting for certainty, you’ll wait forever. If you’re looking for reasonable confidence based on observable patterns, the data from past cycles provides a useful starting point, with the important caveat that past performance never guarantees future results.
The unresolved question that every Bitcoin investor must eventually confront is whether the fundamental thesis — that Bitcoin represents a durable store of value that will appreciate over time as adoption grows — still holds. The historical data can’t answer that question. It can only show you what happened before.