The fear is visceral. Your portfolio is down 60%, headlines scream about cryptocurrency Armageddon, and everyone on social media is declaring Bitcoin dead for the umpteenth time. You’ve heard the phrase “this time is different” before — usually right before things recover. So what’s the actual pattern here? What’s the historical record, and should you trust it?
This isn’t a prediction. I’m not going to tell you whether Bitcoin will crash again or when the next bull market arrives. What I’ll do is walk through every major crash in Bitcoin’s history, document exactly how long recovery took, and examine what actually changed between the crash and the recovery. By the end, you’ll have the raw data to form your own conclusions — no hype, no narrative, just the timeline.
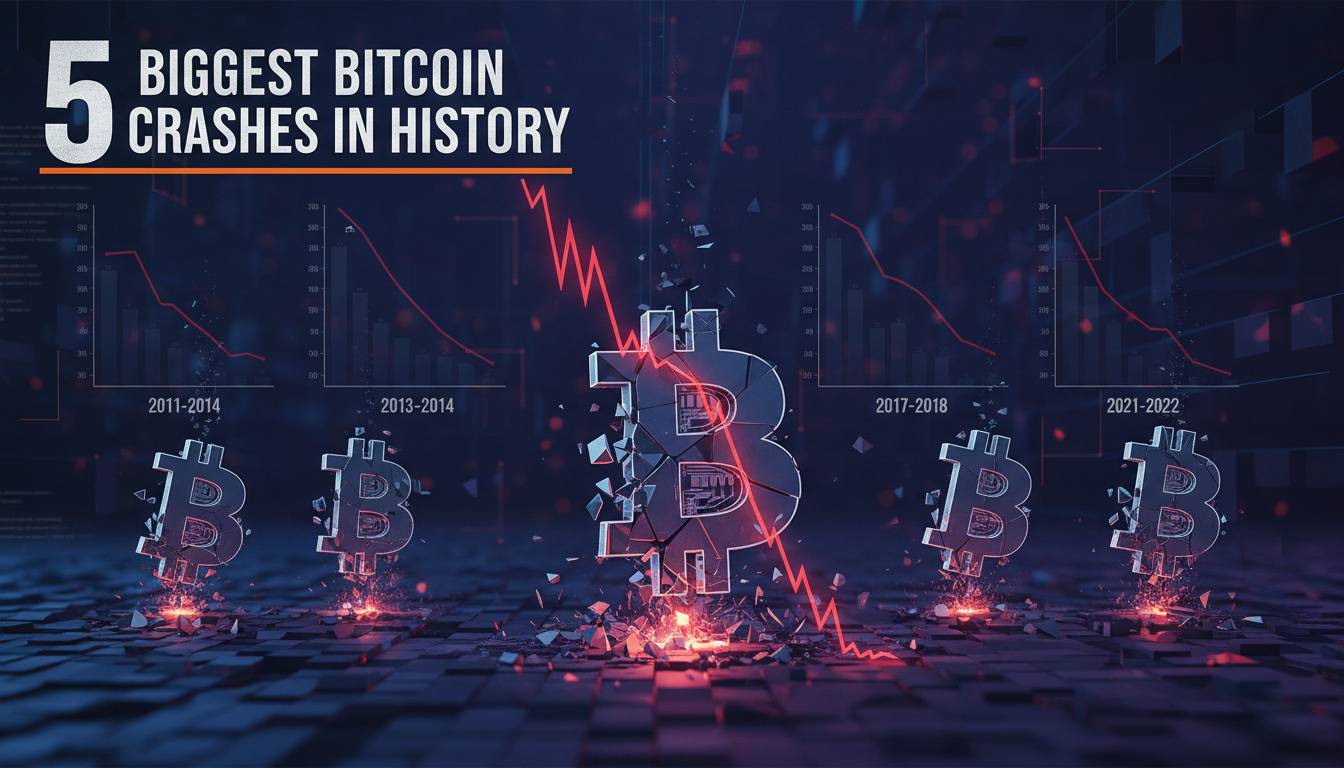
Major Bitcoin Crashes: A Complete History
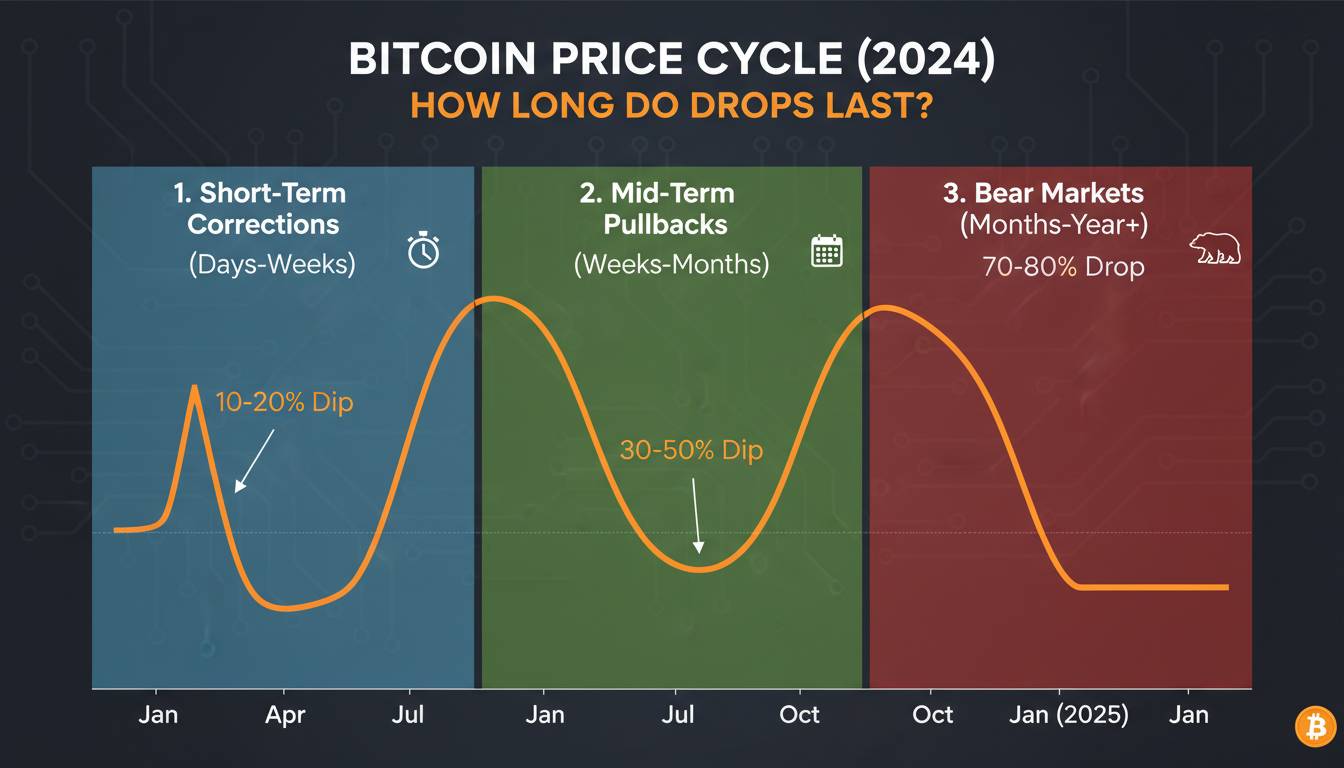
Bitcoin has experienced roughly five distinct crash events that qualify as “major” — defined here as a drawdown of 70% or more from the previous cycle high. Each has a different story, and understanding those stories matters more than the raw price action.
The 2013 Crashes: Two in One Year
Bitcoin’s first real test came in 2013. The year started with Bitcoin around $13 and exploded to $266 by early April — a 20x gain in three months. Then it crashed 70% in weeks. By July, it had recovered to $100. Then the bigger move: from July to December 2013, Bitcoin went from $100 to $1,100, its first trip to four figures. The December crash wiped out 80% of that gain, dropping Bitcoin to around $200 by early 2015.
The recovery from that December 2013 high took roughly 25 months. Bitcoin didn’t retake $1,000 until March 2017 — more than three years after the crash.
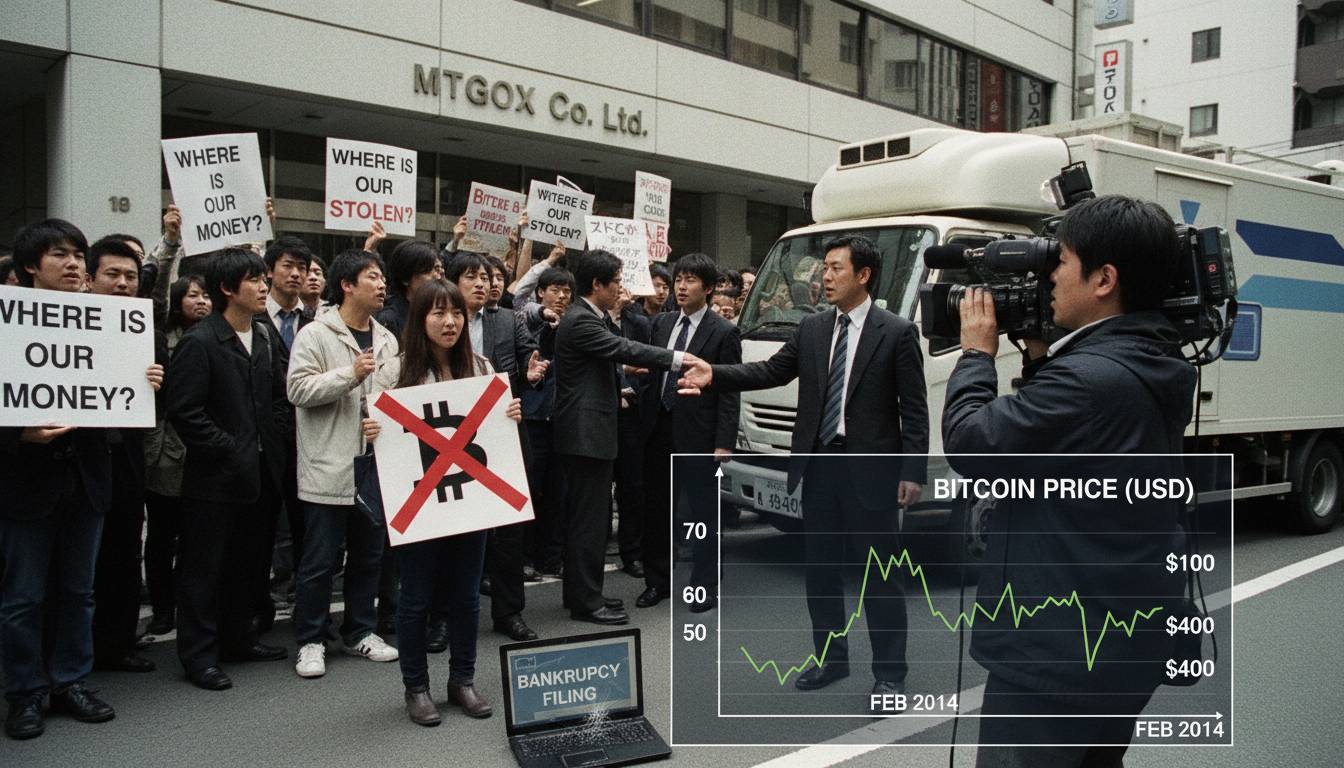
The 2014 Mt. Gox Collapse
The Mt. Gox hack wasn’t just a crash — it was an extinction-level event for the largest Bitcoin exchange. Roughly 850,000 Bitcoin (worth around $450 million at the time, over $50 billion at 2024 prices) disappeared. The price dropped from $600 to under $200 in a matter of weeks. Confidence in Bitcoin as a system was genuinely shaken.
What followed was the “crypto winter” of 2014-2015. Bitcoin traded in the $200-$300 range for almost two years. The recovery wasn’t dramatic — it was slow, grinding, and accompanied by near-zero mainstream interest. Bitcoin didn’t hit $1,000 again until early 2017, but by then the ecosystem had fundamentally changed. New exchanges, better custody solutions, and the first wave of institutional curiosity had emerged.
The 2017-2018 Cycle: The ICO Mania Crash
This is the crash most people remember. Bitcoin went from $1,000 in January 2017 to nearly $20,000 by December. The parabolic move was driven by initial coin offerings (ICOs), media frenzy, and retail FOMO on a scale no one had seen before.
The crash was brutal. Bitcoin lost 80% of its value over 12 months, hitting a low of around $3,200 in December 2018. But here’s what many forget: the recovery was surprisingly quick by historical standards. Bitcoin broke back above $10,000 by July 2019, recovered its previous high by late 2020, and then exploded to $64,000 by April 2021.
Total recovery time from the December 2018 low to new all-time highs: approximately 15 months. That’s faster than either the 2013 or 2014 crash recovery.
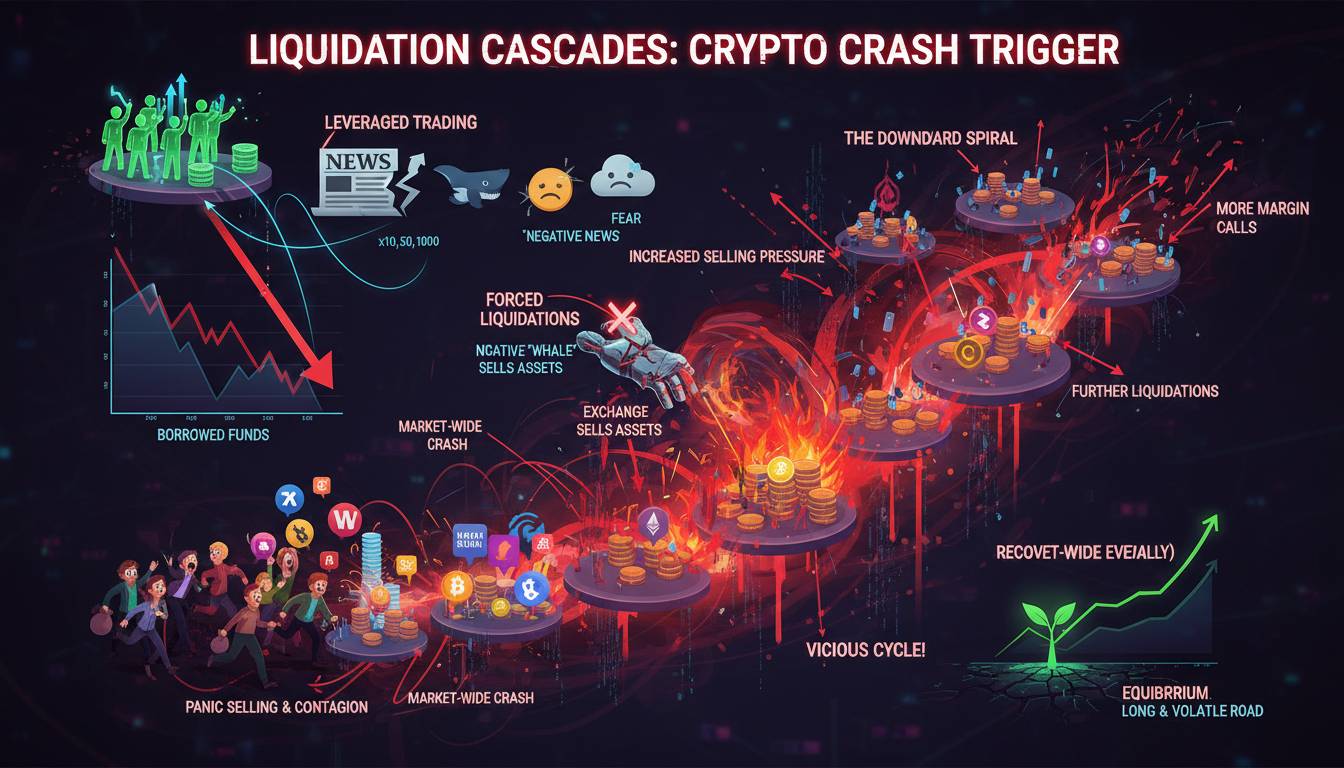
The 2022 Crash: The Great Deleveraging
The 2022 collapse was unique in its mechanics. Unlike previous crashes driven primarily by speculative excess, 2022 saw a cascade of failures: Terra/Luna’s $40 billion collapse, Three Arrows Capital’s implosion, Celsius and FTX’s bankruptcies. It was less a speculative bubble bursting and more a financial system stress test.
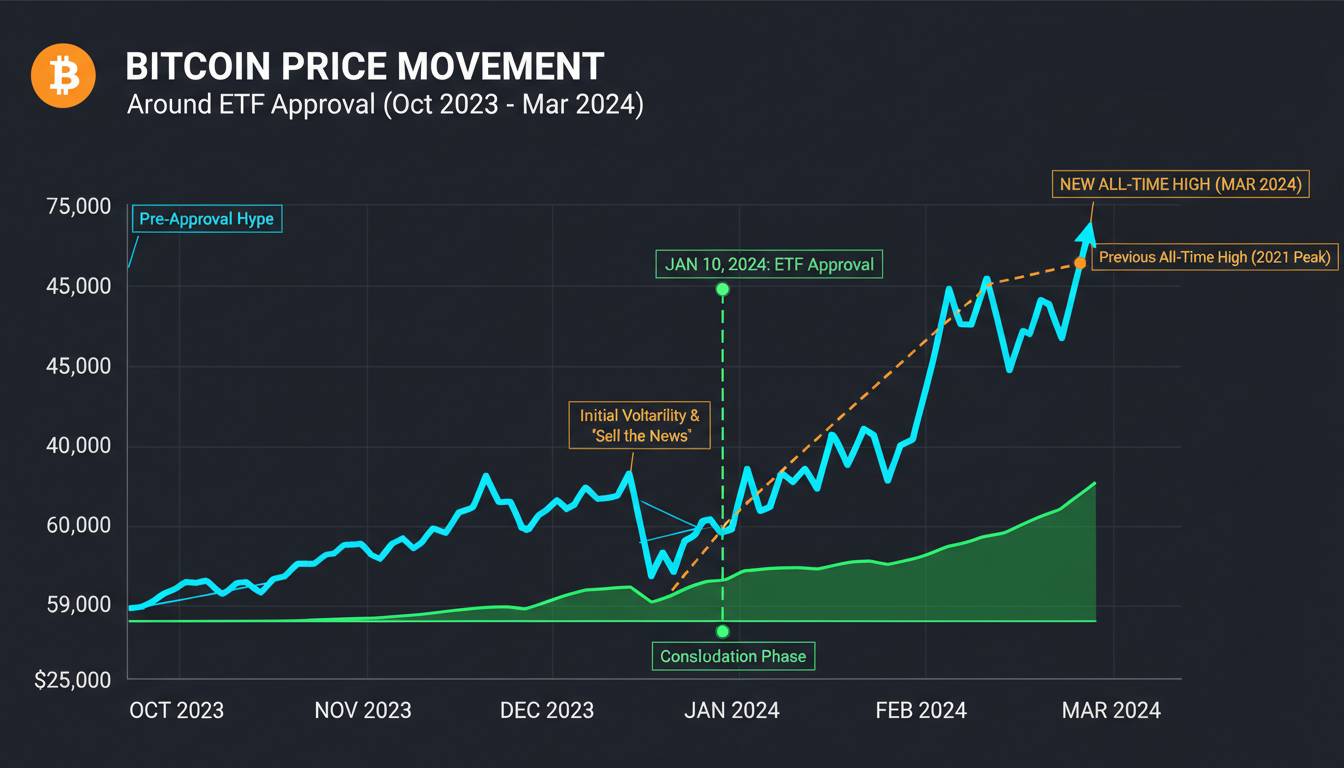
Bitcoin dropped from $69,000 in November 2021 to around $16,000 by November 2022 — a 77% drawdown. The bottom was reached in late 2022, and recovery began almost immediately. By early 2024, Bitcoin had broken back above $50,000. By late 2024, it had surpassed its previous all-time high, reaching six figures.
The 2022 crash’s recovery to new highs took roughly 12-18 months — the fastest recovery in Bitcoin’s history.
What the Historical Data Actually Shows
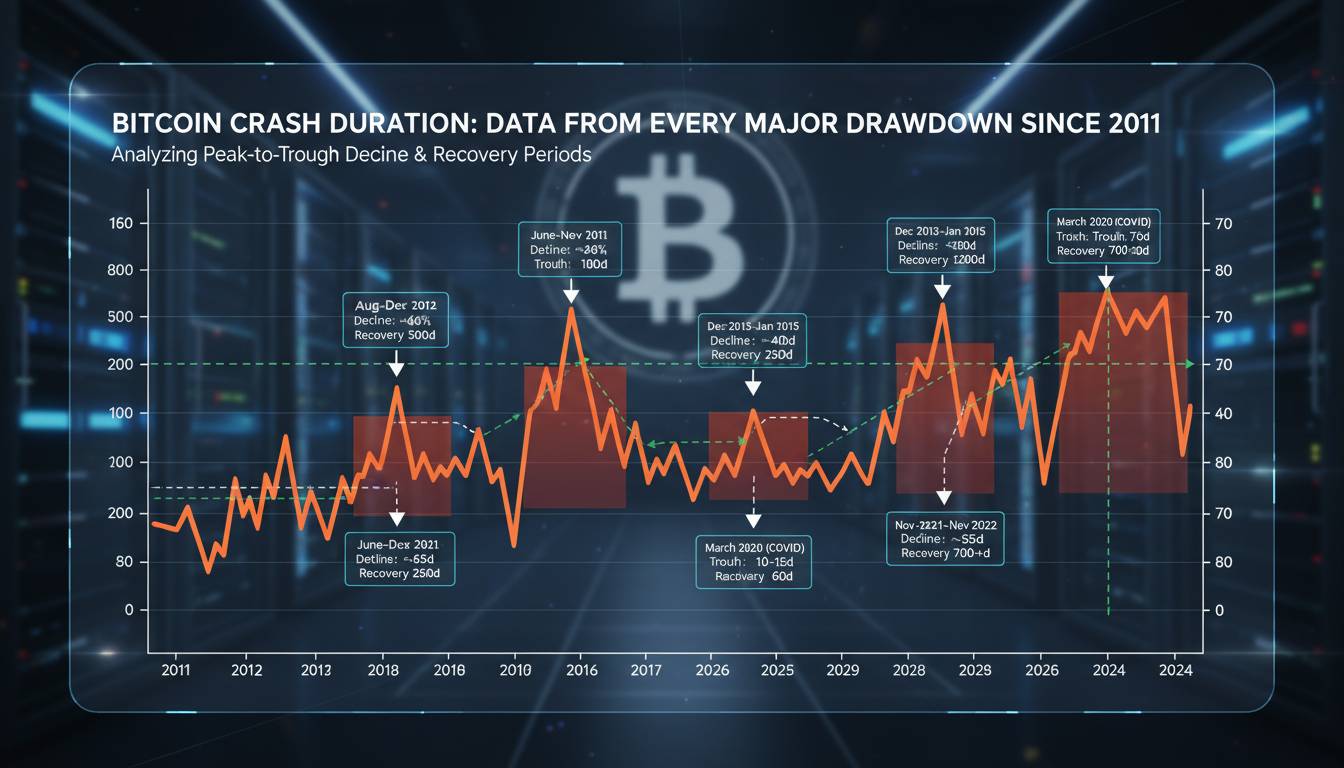
Here’s the data in a table:
| Crash Event | Peak Price | Bottom Price | Drawdown | Recovery to New High |
|---|---|---|---|---|
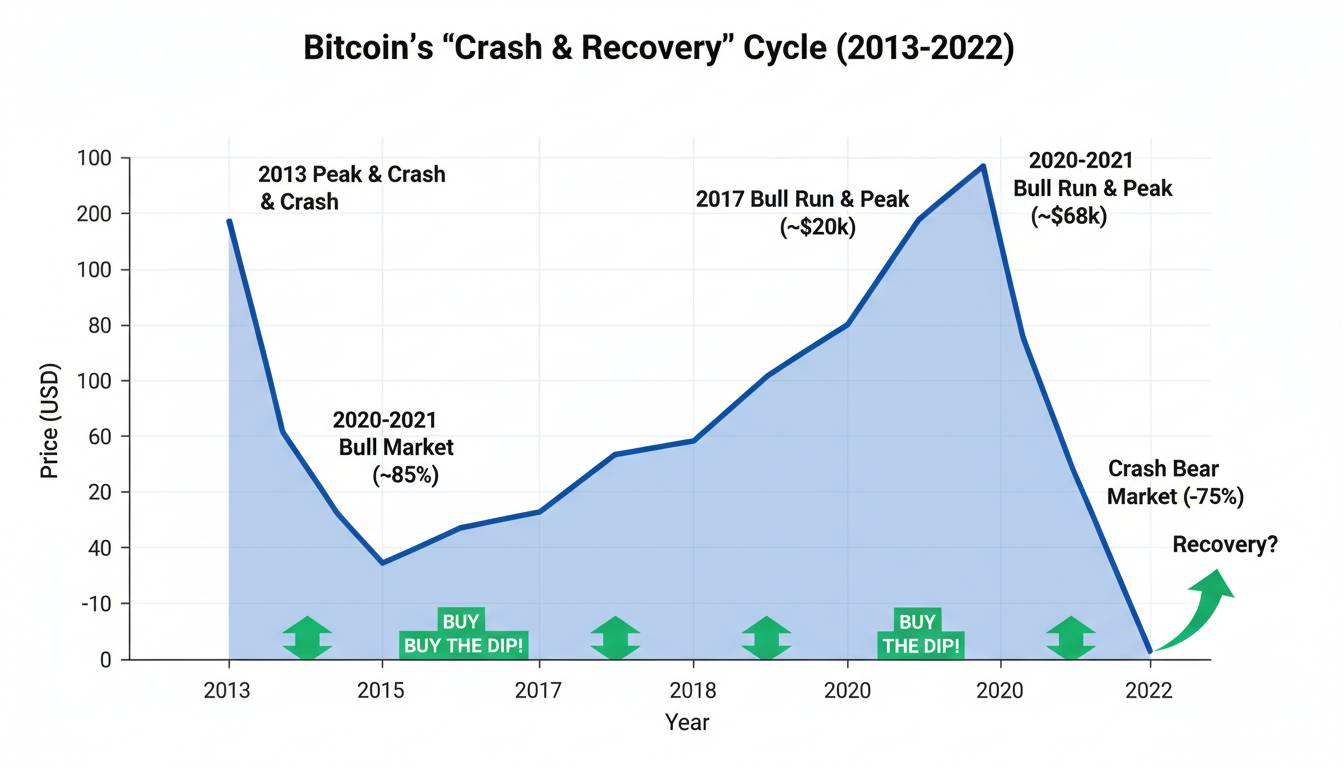
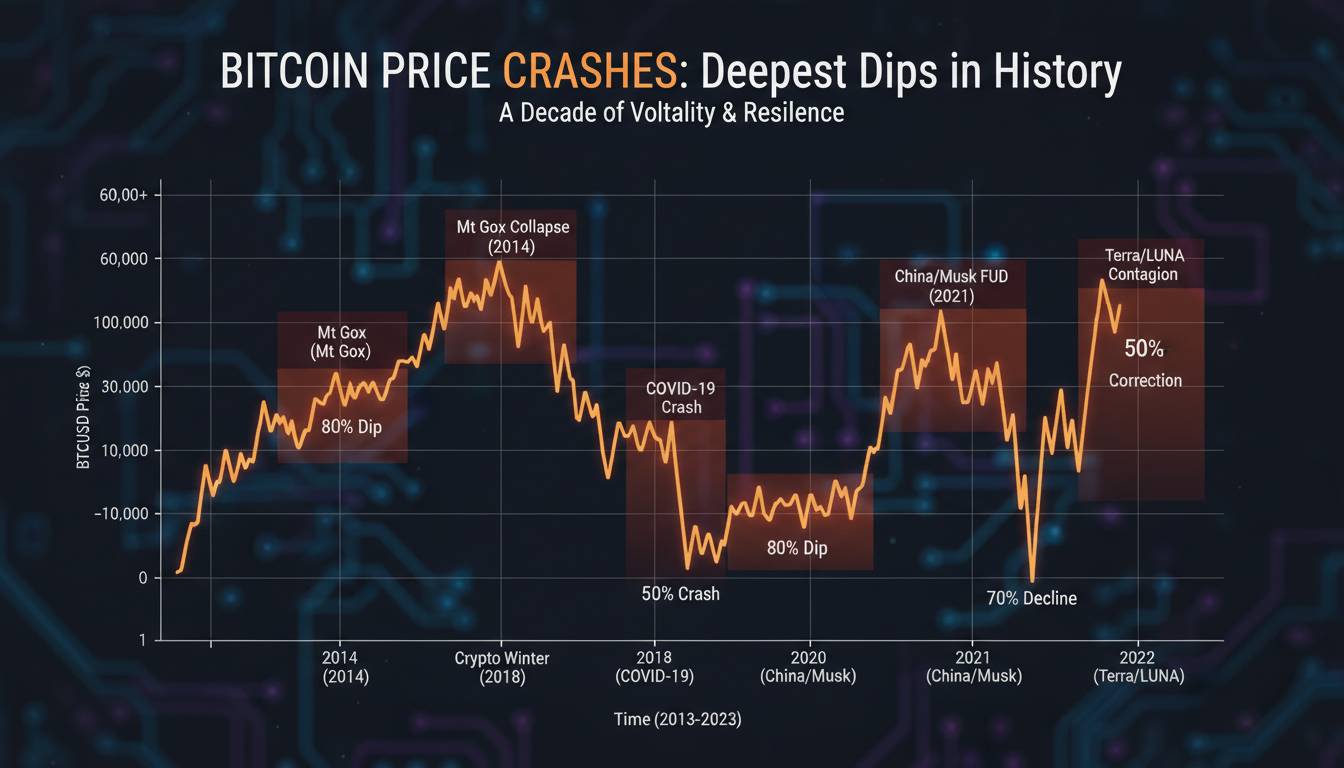
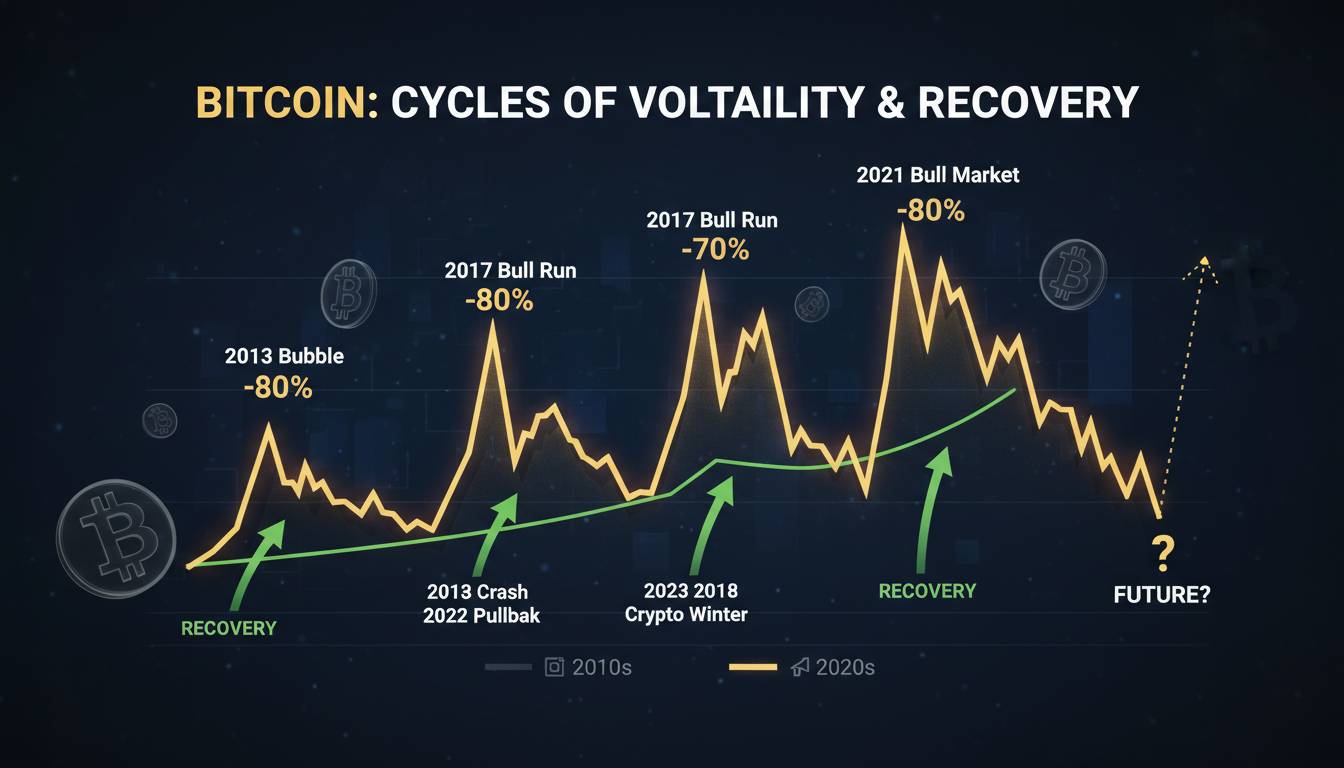
| Dec 2013 | $1,100 | $200 | 82% | ~37 months |
| Dec 2017 | $19,800 | $3,200 | 84% | ~38 months |
| Nov 2021 | $69,000 | $16,000 | 77% | ~12-18 months |
The data reveals something interesting: the percentage decline has been remarkably consistent, hovering between 77-84% across every major crash. This is a tight range for an asset that has grown from cents to tens of thousands of dollars.
The recovery time, however, has been decreasing. The 2013 and 2017 crashes took roughly three years to reach new highs. The 2022 crash took roughly one year. That’s a meaningful pattern — recovery is getting faster.
I need to be honest about what this data doesn’t tell you. The sample size is tiny. We’re talking about four major crashes in 15 years. You cannot build a reliable statistical model on four data points. Anyone telling you they can predict the next recovery based on this is selling something.
Why Bitcoin Has Recovered — And Why the Pattern Might Break
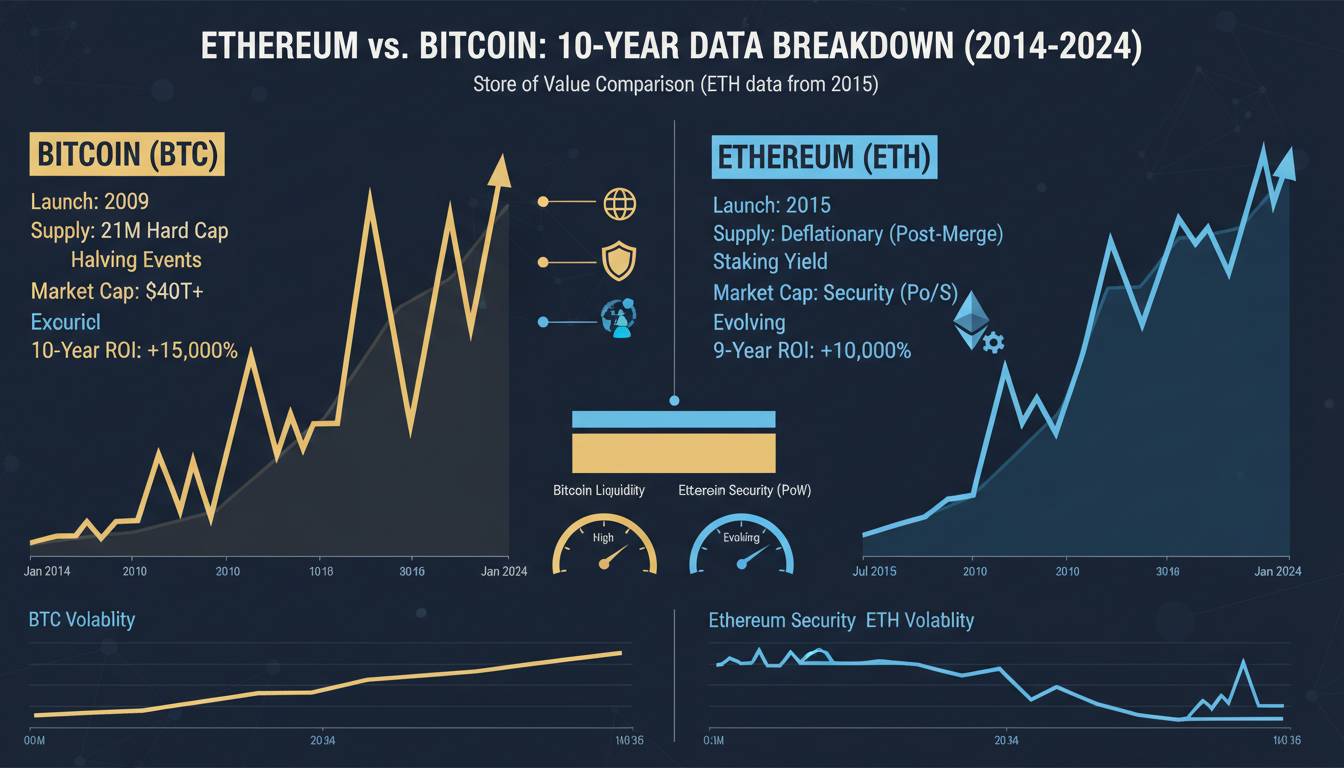
Here’s the conventional narrative: Bitcoin’s scarcity (21 million supply cap), increasing adoption, and store-of-value narrative ensure that every crash is eventually followed by a new high. This is what Bitcoin holders believe, and there’s evidence to support it.
But there’s a counter-argument worth considering, and it’s the one that keeps many sophisticated investors on the sidelines.
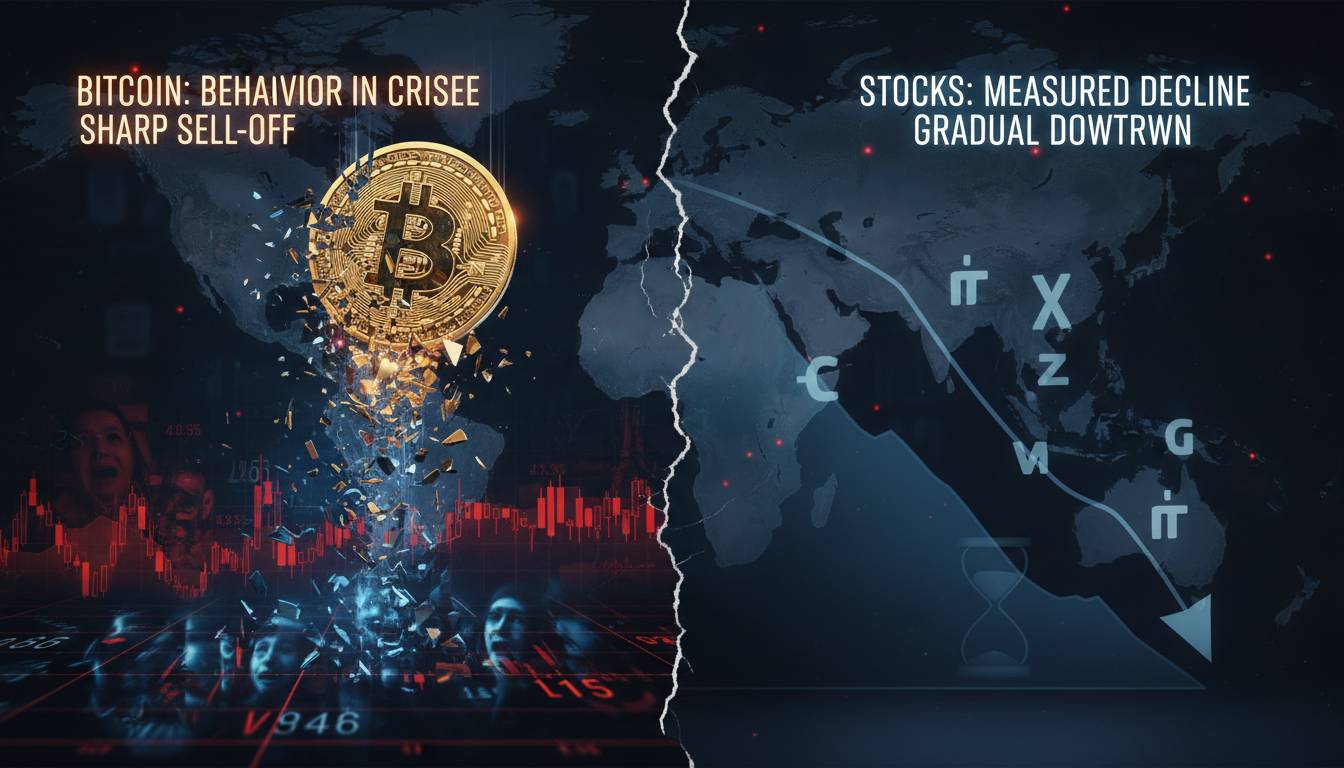
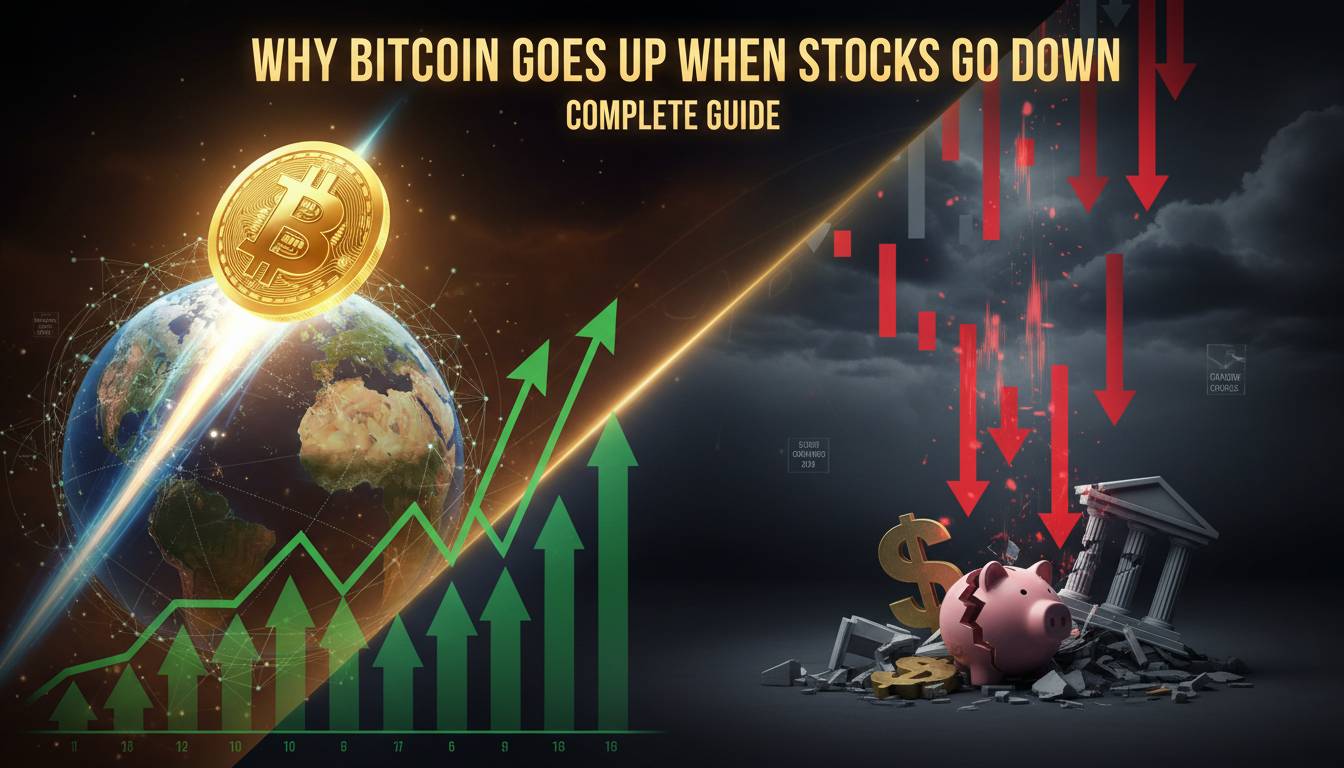
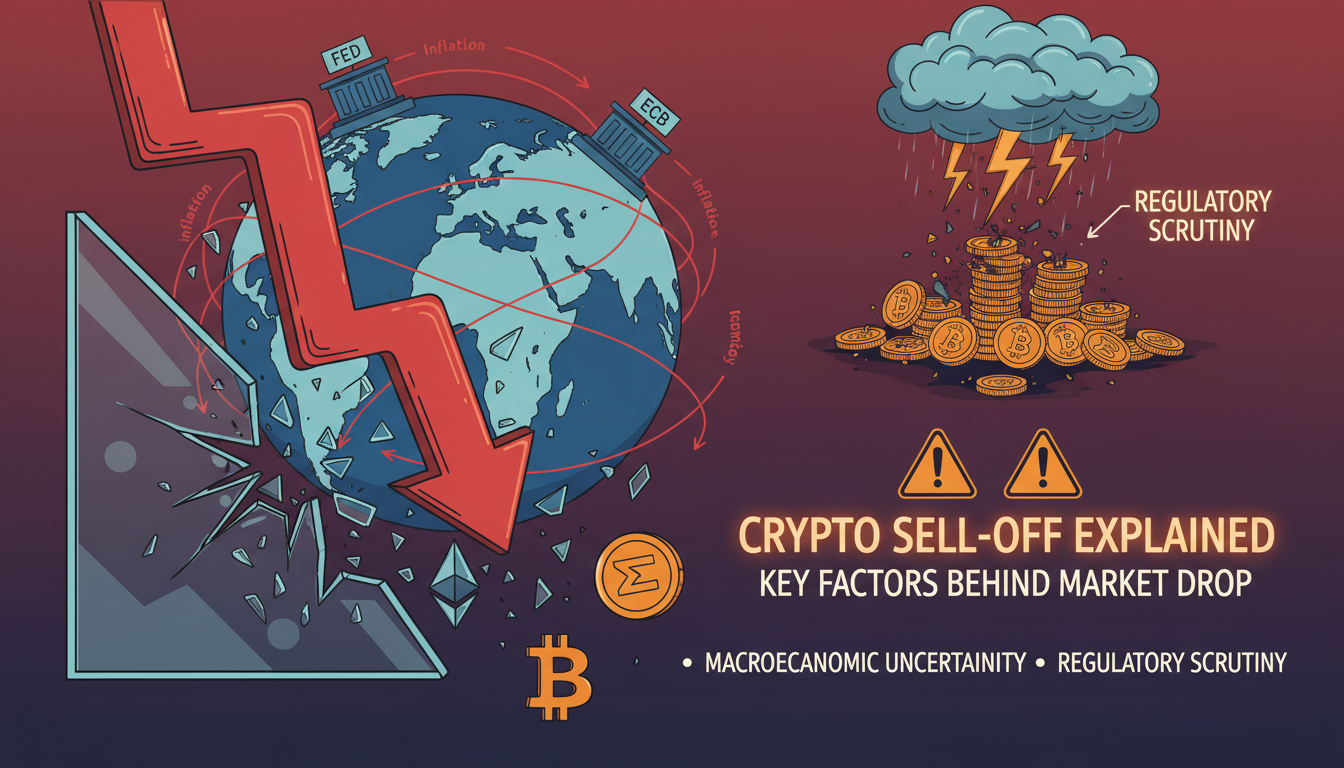
The macro environment has changed dramatically. In 2013 and 2017, Bitcoin was a curiosity — a niche asset with minimal correlation to traditional markets. By 2022, Bitcoin was correlated with tech stocks, interest rate expectations, and global liquidity conditions. When the Federal Reserve tightened, Bitcoin fell alongside equities. The “uncorrelated asset” narrative broke during the 2022 crash.
If that correlation holds — and there’s evidence it has strengthened, not weakened — then Bitcoin’s recovery becomes dependent on broader market conditions rather than just its own cycle. This means the next crash might not follow the same playbook. It might recover faster because of massive stimulus, or it might take years if we’re in a prolonged recessionary environment.
I’ve seen this dynamic play out in other markets. Assets that claim uncorrelated status often discover correlations during true crises. Bitcoin might genuinely be “digital gold” — but gold also got crushed in 2022 alongside everything else.
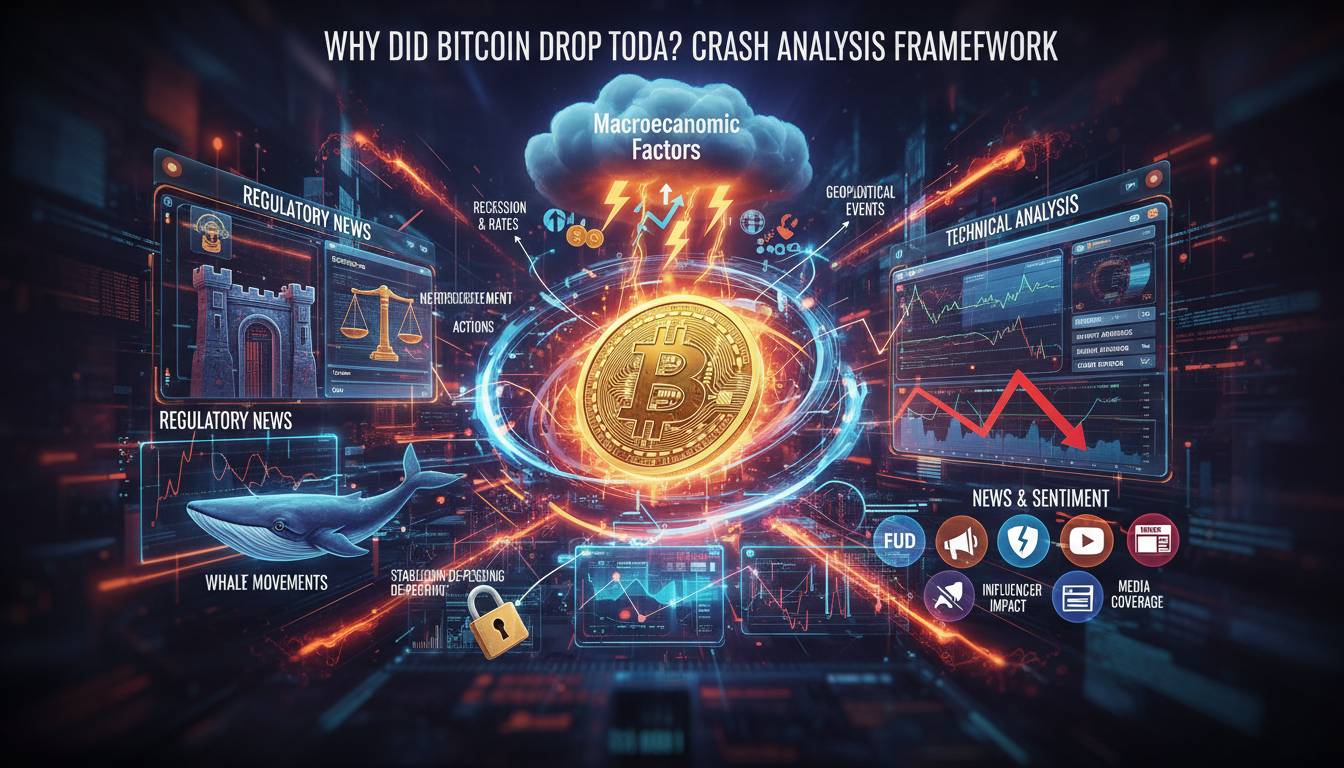
What Actually Drives Recovery
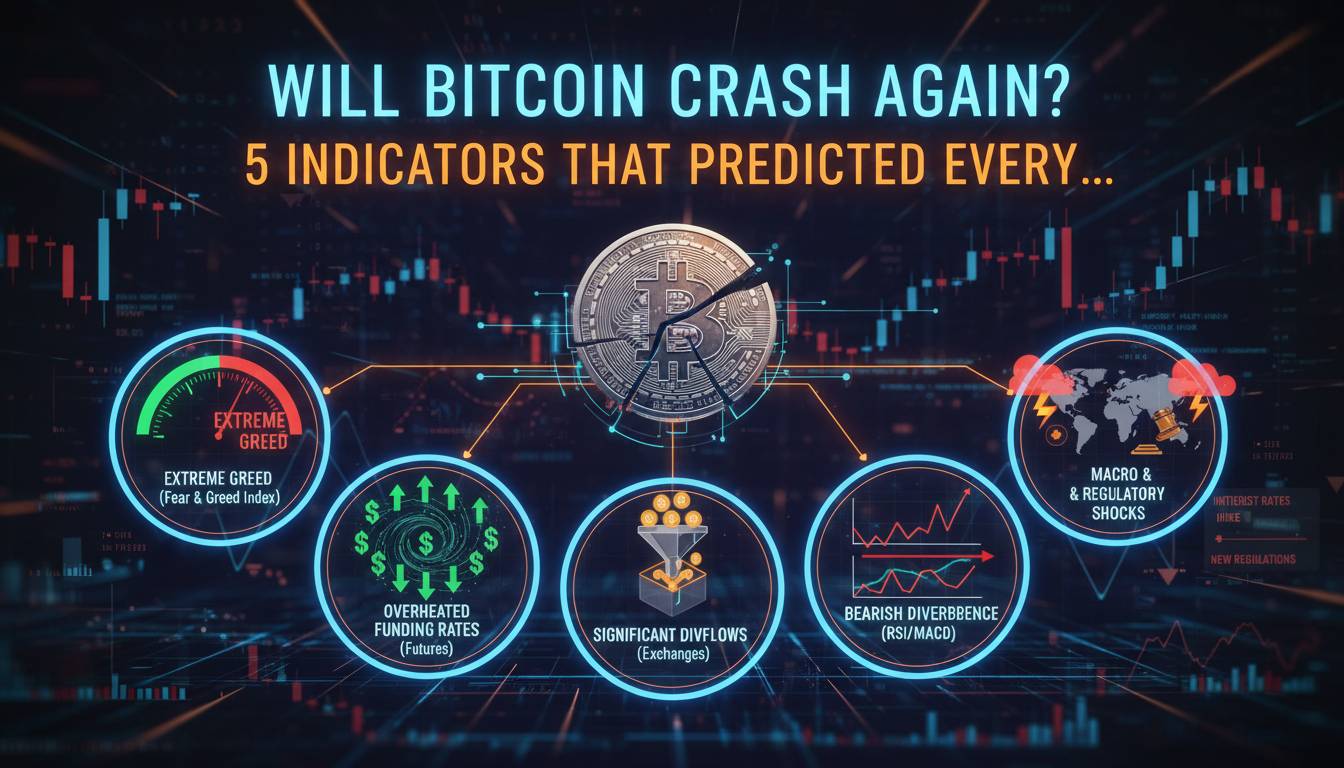
If you want to understand when Bitcoin might recover, look at these factors rather than price charts:
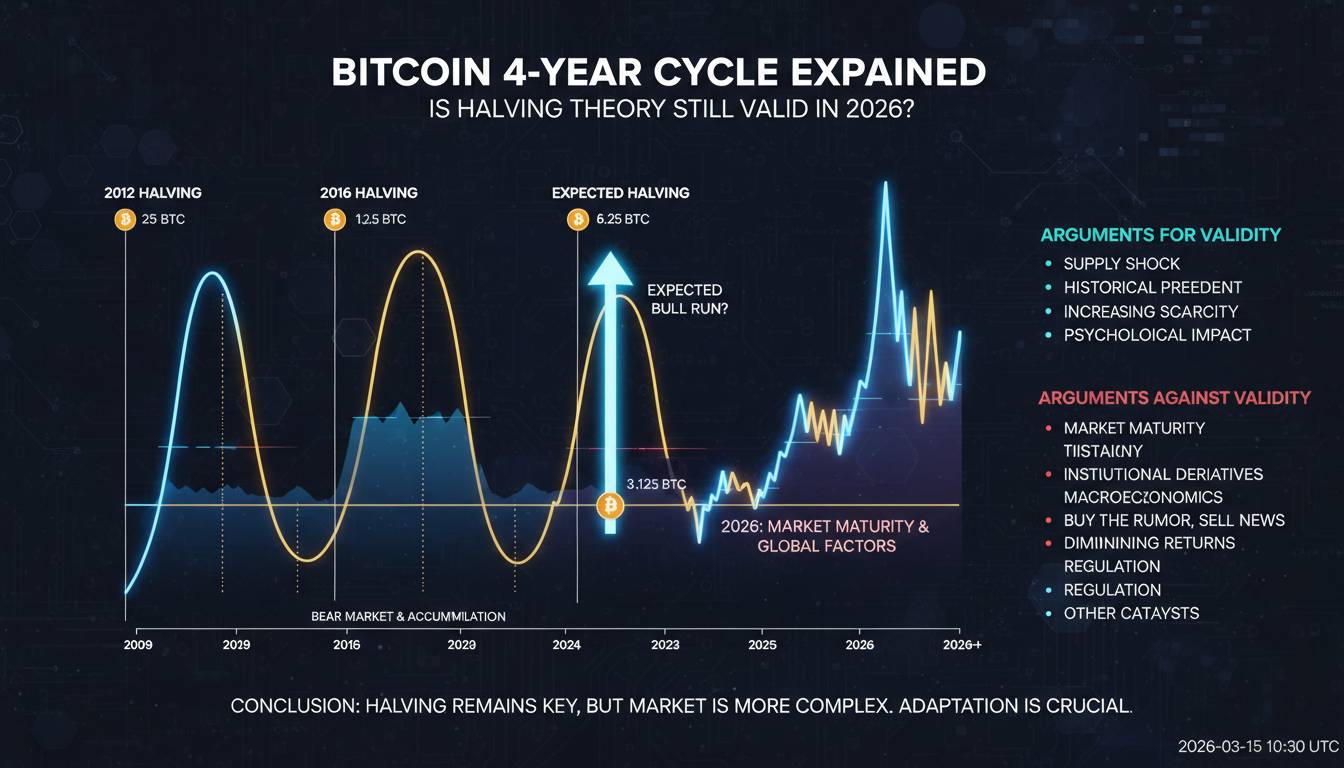
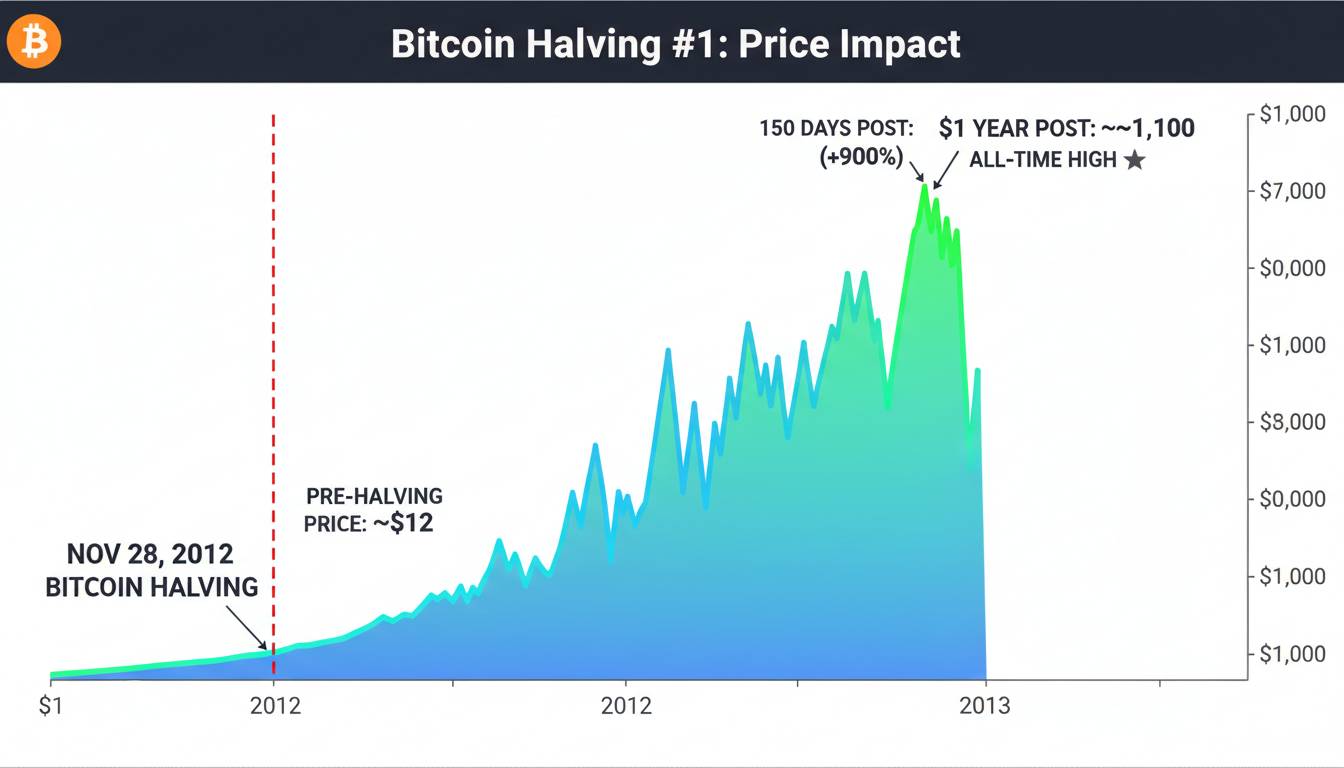
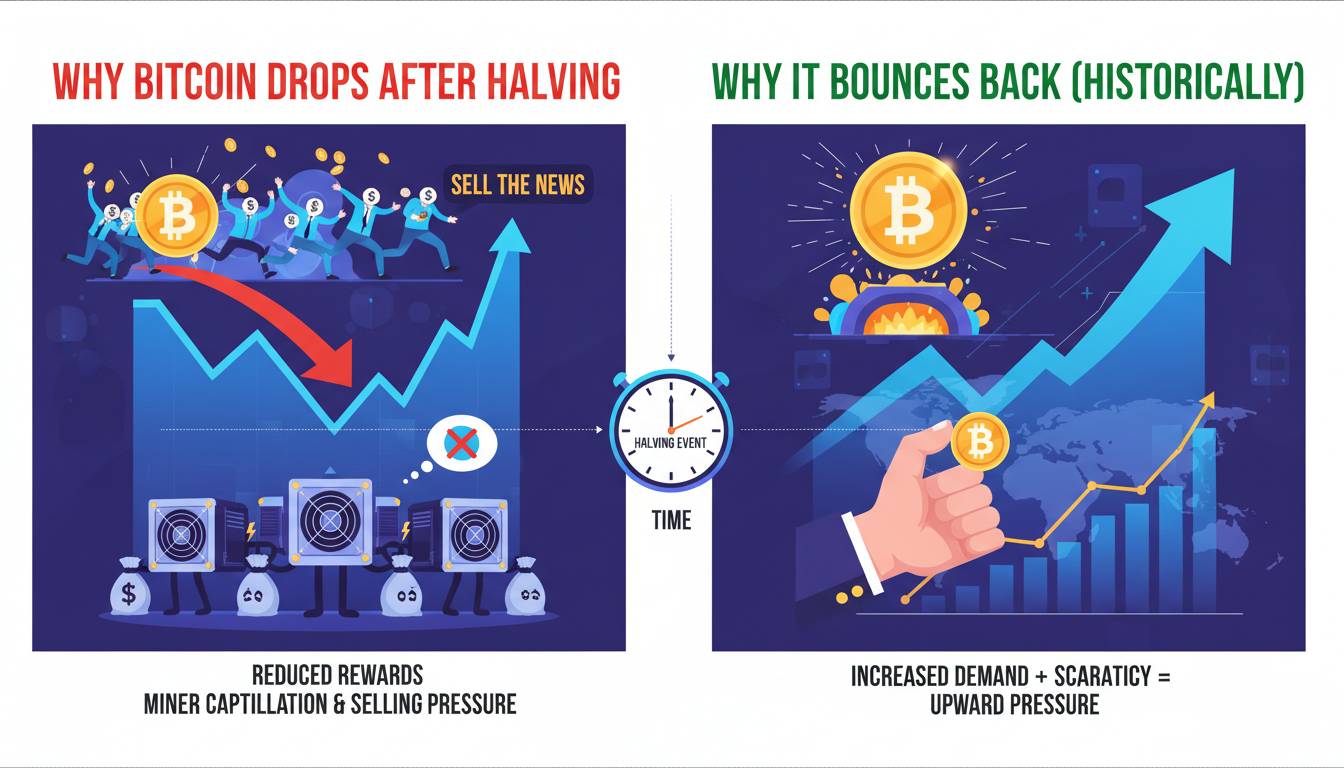
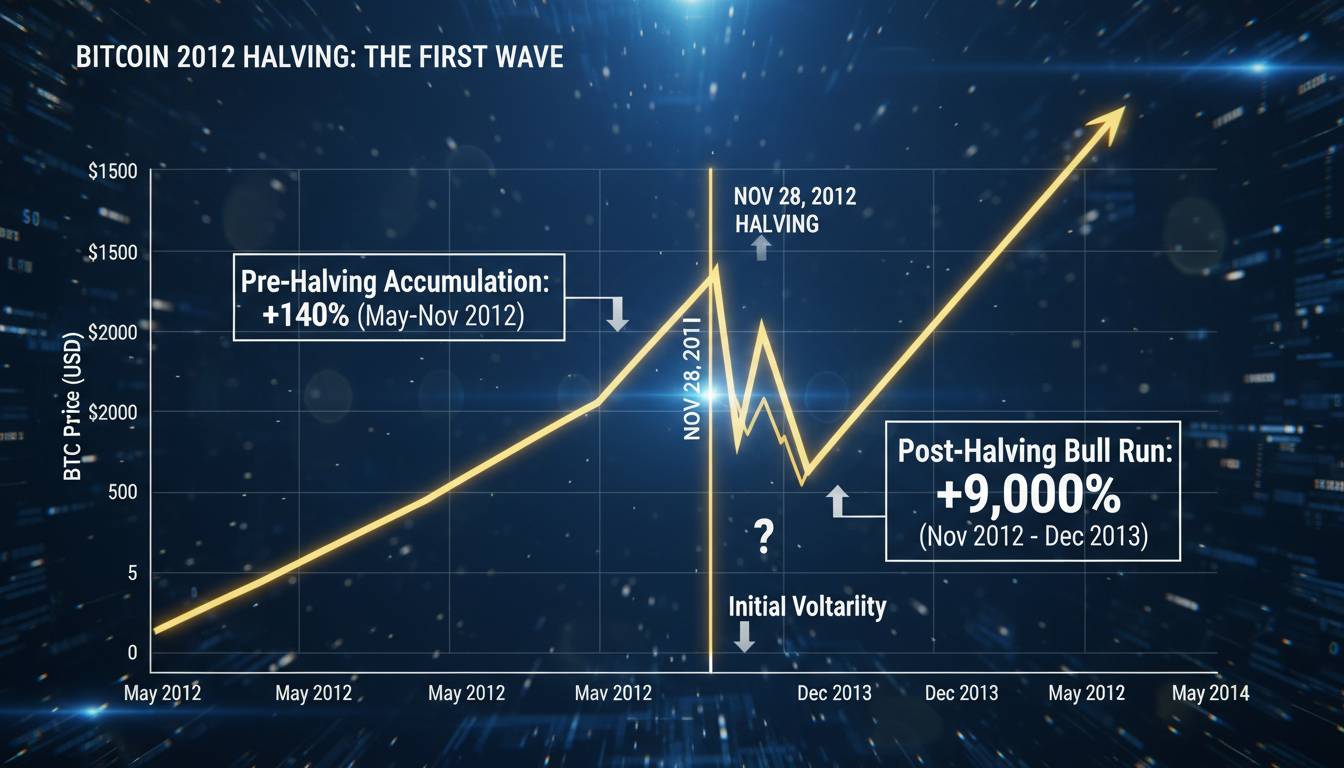
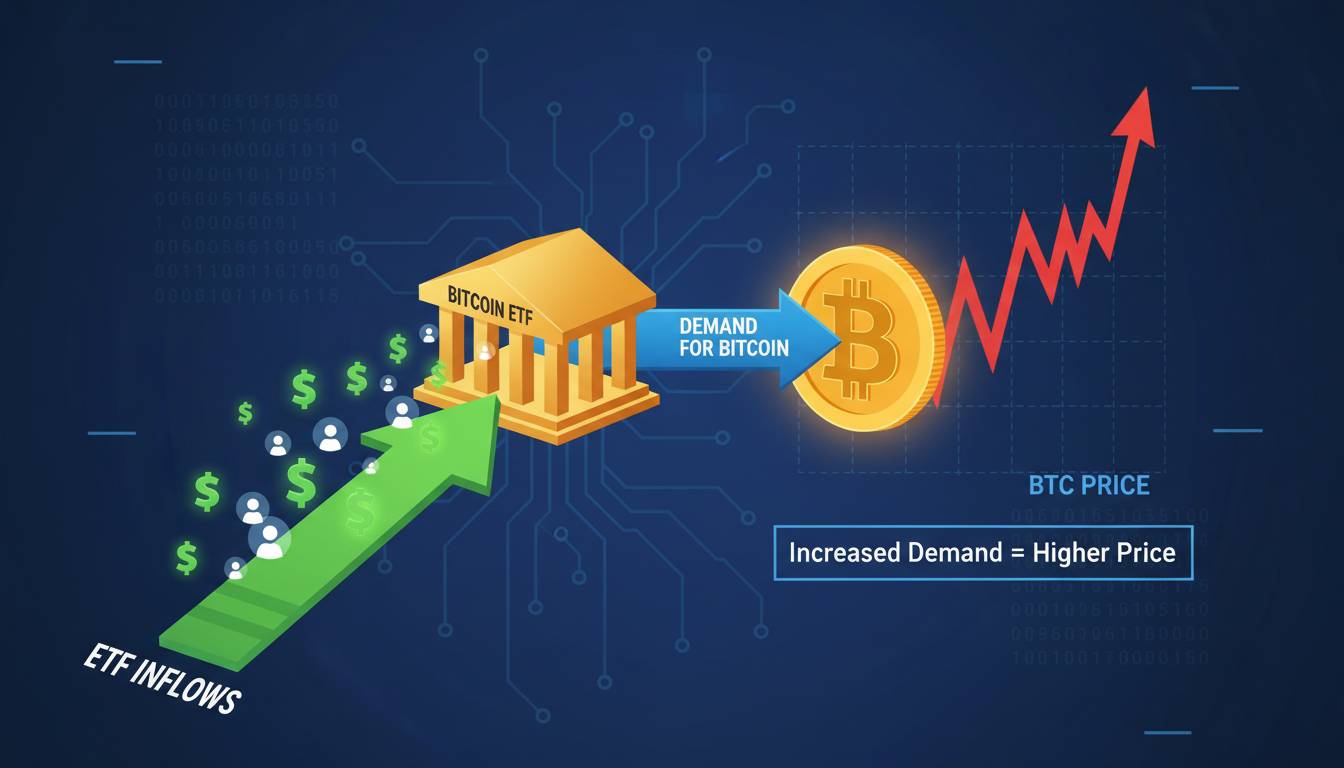
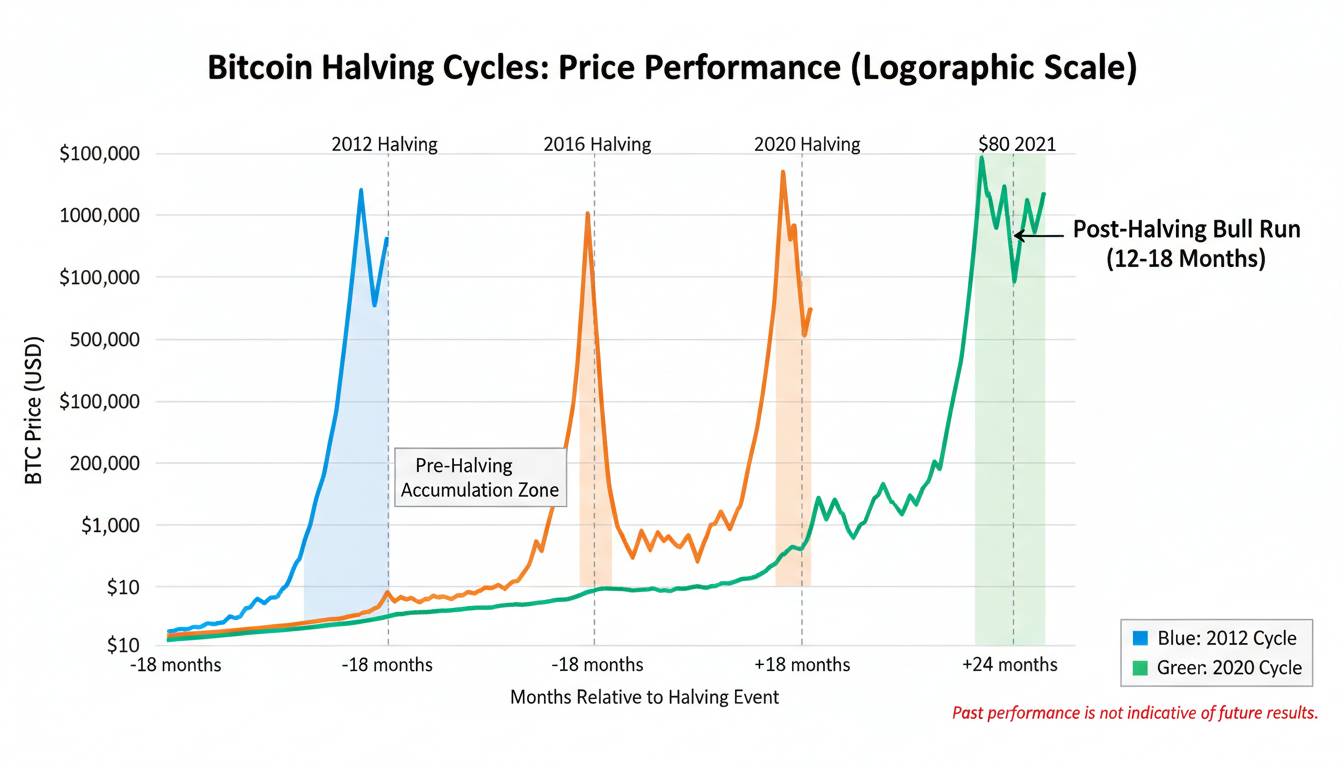
Halving cycles matter, but not in the way most people think. The block reward halving (when miner rewards cut in half, reducing new supply) has preceded every major Bitcoin rally since 2012. The 2024 halving followed by Bitcoin’s run to $100,000 fits this pattern. But correlation isn’t causation — the halving is predictable, so markets price it in. The real question is whether demand grows faster than reduced supply.
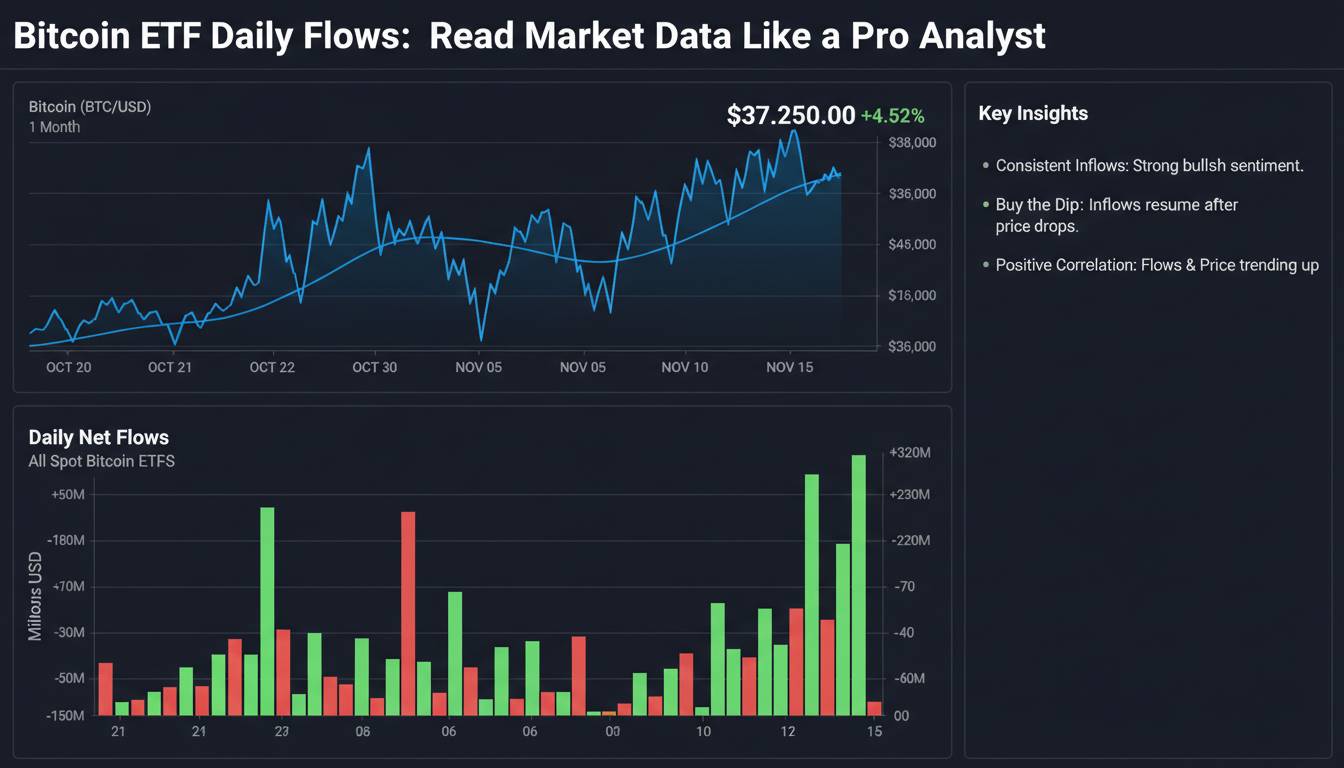
Institutional adoption creates support floors. The 2020-2021 rally was driven by MicroStrategy, Tesla, and various hedge funds accumulating Bitcoin on balance sheets. This created a structural demand source that didn’t exist in previous cycles. The 2022 crash tested whether these buyers would hold during a liquidity crisis — some did (MicroStrategy is still buying), some didn’t (Tesla sold most of its holdings). The survivors became price anchors.
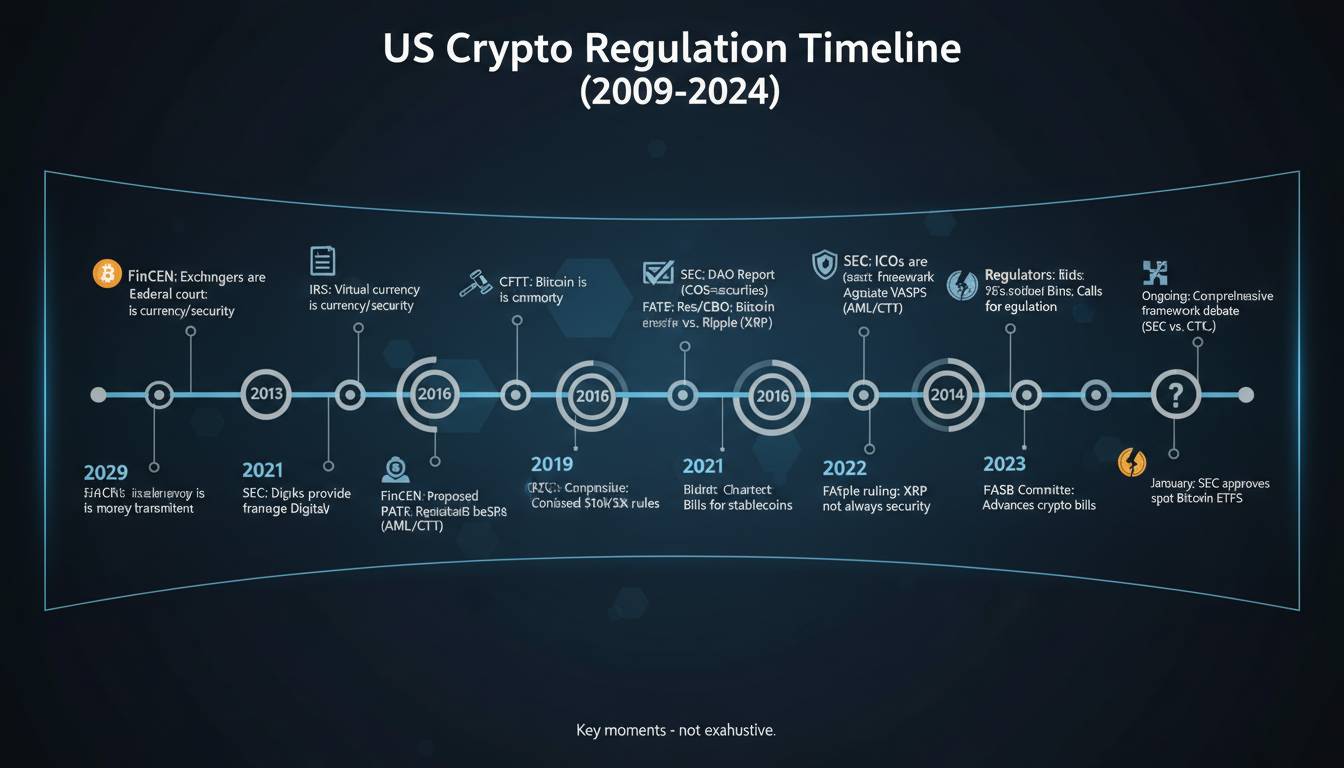
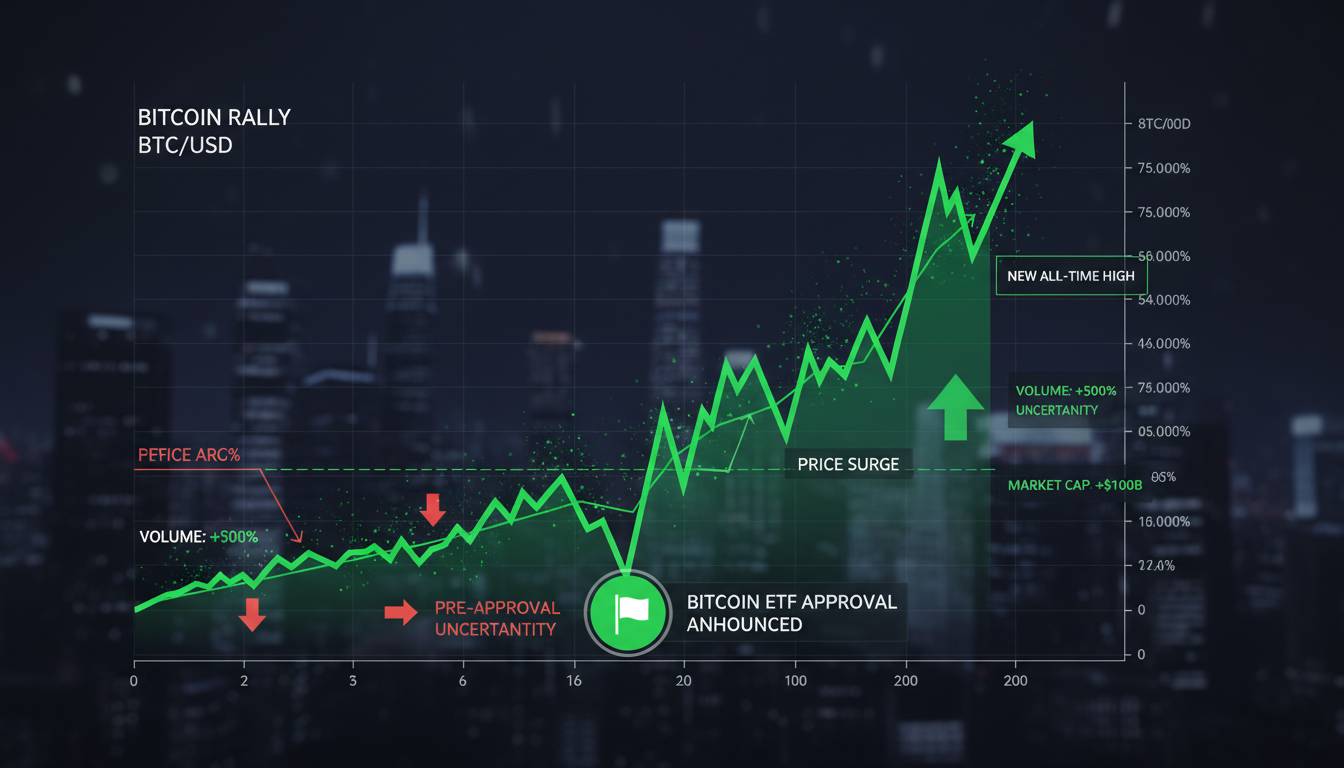
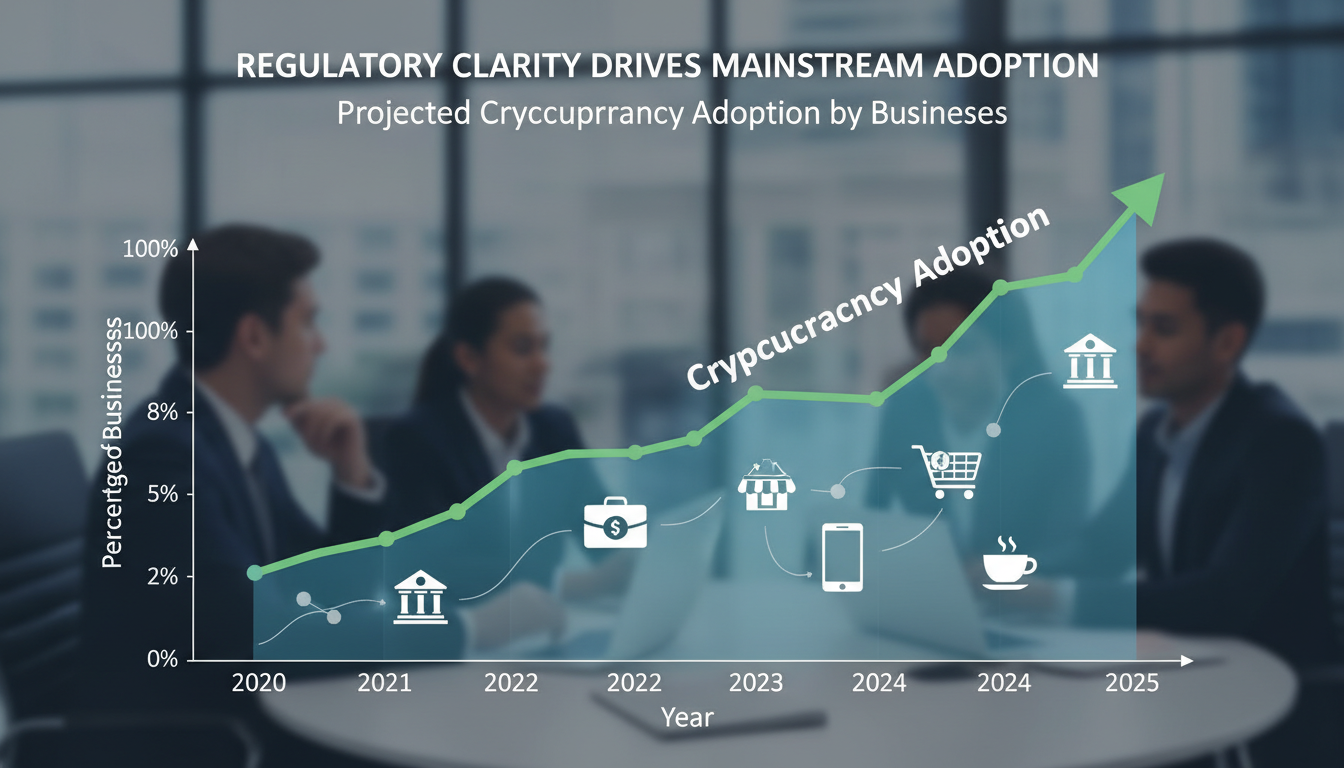
Regulatory clarity reduces risk premium. Every crash cycle has featured regulatory uncertainty as a headwind. The 2014 Mt. Gox crash was partly about exchange risk. The 2017 crash included China ban fears. The 2022 crash included SEC enforcement actions against exchanges. Each subsequent cycle has slightly more regulatory clarity, which reduces the crash amplitude — though it also might limit the upside.
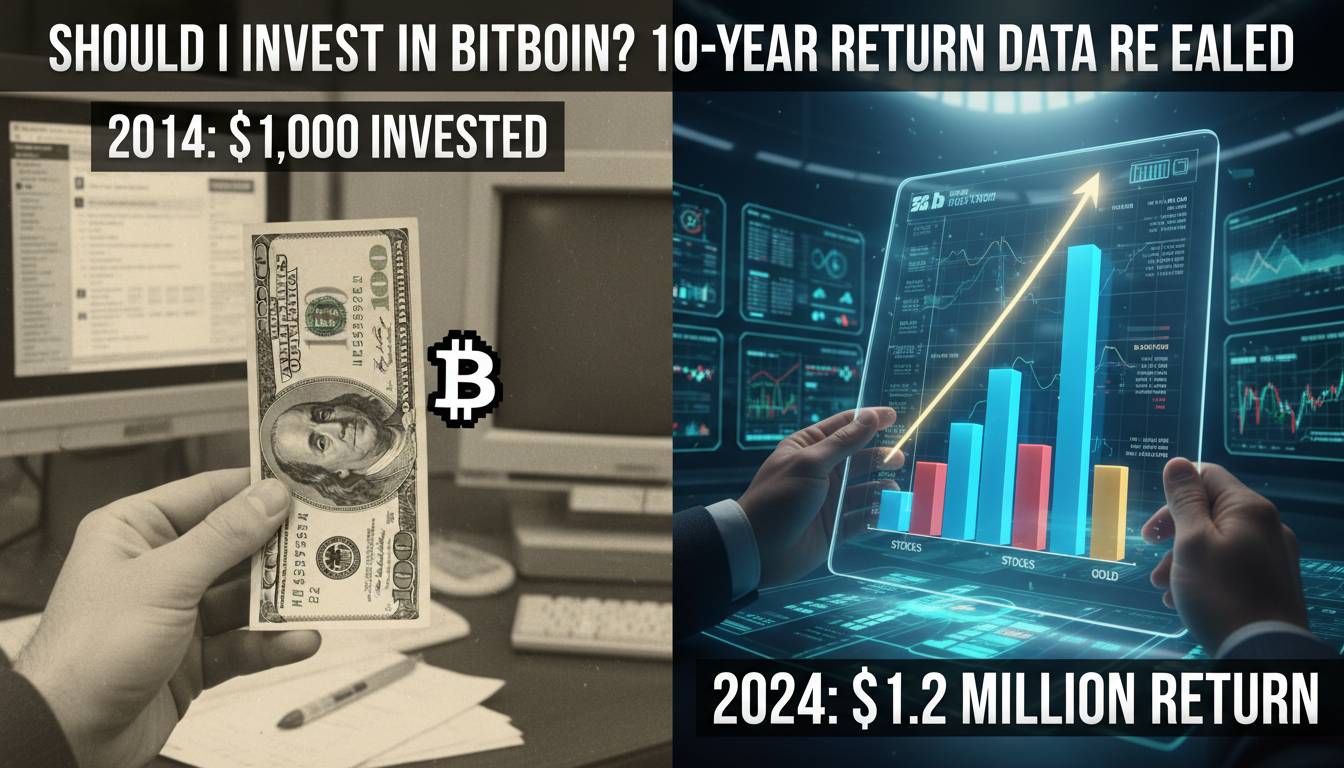
Should You Buy Bitcoin After a Crash?
This is the question everyone actually wants answered, even though they ask about historical timelines first. Let me give you an actual framework rather than a yes or no.
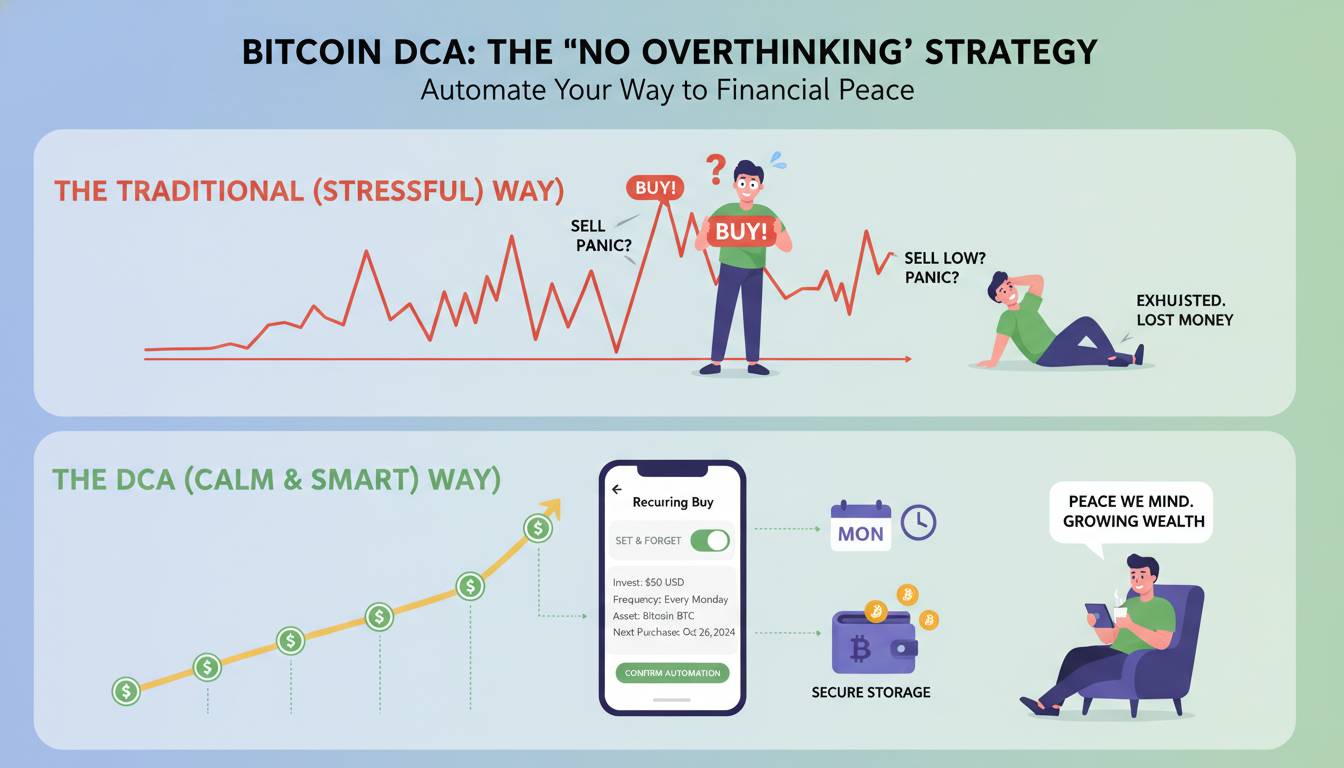
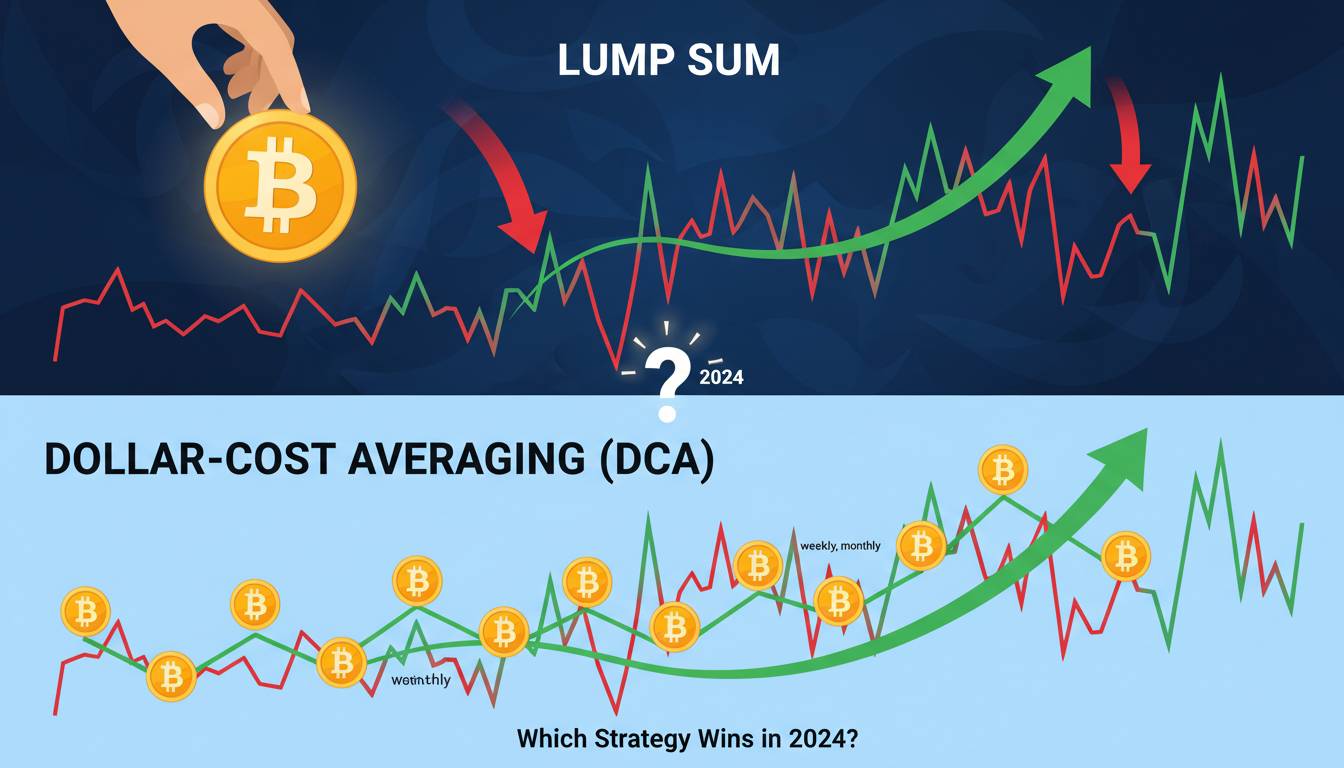
Dollar-cost averaging (DCA) into Bitcoin after a major crash has been historically profitable. If you had bought Bitcoin monthly starting in January 2019 (the worst possible timing before the 2019 rally), you would have been profitable by mid-2020. If you had started in January 2023, you were profitable within months. The strategy works because it removes the timing risk.
But here’s the honest truth: DCA only works if you can hold through another 70% drawdown without selling. Most people who say they’d “buy the dip” actually panic sell. Before you commit to a DCA strategy, honestly assess whether you’d stick with it when your investment is down 50% and headlines are calling Bitcoin a Ponzi scheme. If you can’t stomach that, don’t invest what you can’t afford to lose.
The more practical question is position sizing. In a diversified portfolio, Bitcoin’s volatility is manageable at a 1-5% allocation. At 10% or more, it becomes the dominant driver of your portfolio’s performance. Most people would benefit from starting small and increasing exposure only after they’ve experienced a crash and held.
Frequently Asked Questions
How long did Bitcoin take to recover from the 2022 crash?
Bitcoin reached a new all-time high in late 2024, approximately 12-18 months after the November 2022 bottom. This was the fastest recovery in Bitcoin’s history.
What was Bitcoin’s biggest crash percentage-wise?
The December 2013 peak-to-trough decline was approximately 87% when measured from the intraday high to the cycle low. The 2017 crash saw an 84% drawdown. The 2022 crash was 77%.
Does Bitcoin always recover from crashes?
Based on historical data, yes — Bitcoin has recovered from every crash to reach new highs. However, past performance doesn’t guarantee future results, and the sample size is small. The asset is only 15 years old.
Is it worth buying Bitcoin after a crash?
From a historical standpoint, buyers who held for at least two years after buying near cycle lows have always been profitable. However, this doesn’t account for future regulatory risks, market structure changes, or black swan events. Personal risk tolerance should guide this decision.
Looking Forward
If there’s one thing to take away from this analysis, it’s that Bitcoin’s crash-and-recovery pattern is real but evolving. The recovery has gotten faster with each cycle — three years, then three years, then one year. Whether that trend continues depends on factors that didn’t exist in earlier cycles: institutional balance sheet holdings, ETF flows, sovereign wealth fund interest, and regulatory frameworks that didn’t exist five years ago.
The honest answer is that no one knows whether Bitcoin will recover from the next crash. What’s different now is that the infrastructure supporting Bitcoin — exchanges, custody, regulation, institutional adoption — is far more robust than it was during the Mt. Gox era. That doesn’t prevent crashes, but it does change how the recovery might unfold.
What I can tell you is this: every person who held through a crash and bought more during the downturn has been rewarded. That pattern held in 2013, 2014, 2018, and 2022. Whether it holds again is the bet you’re making if you choose to invest.