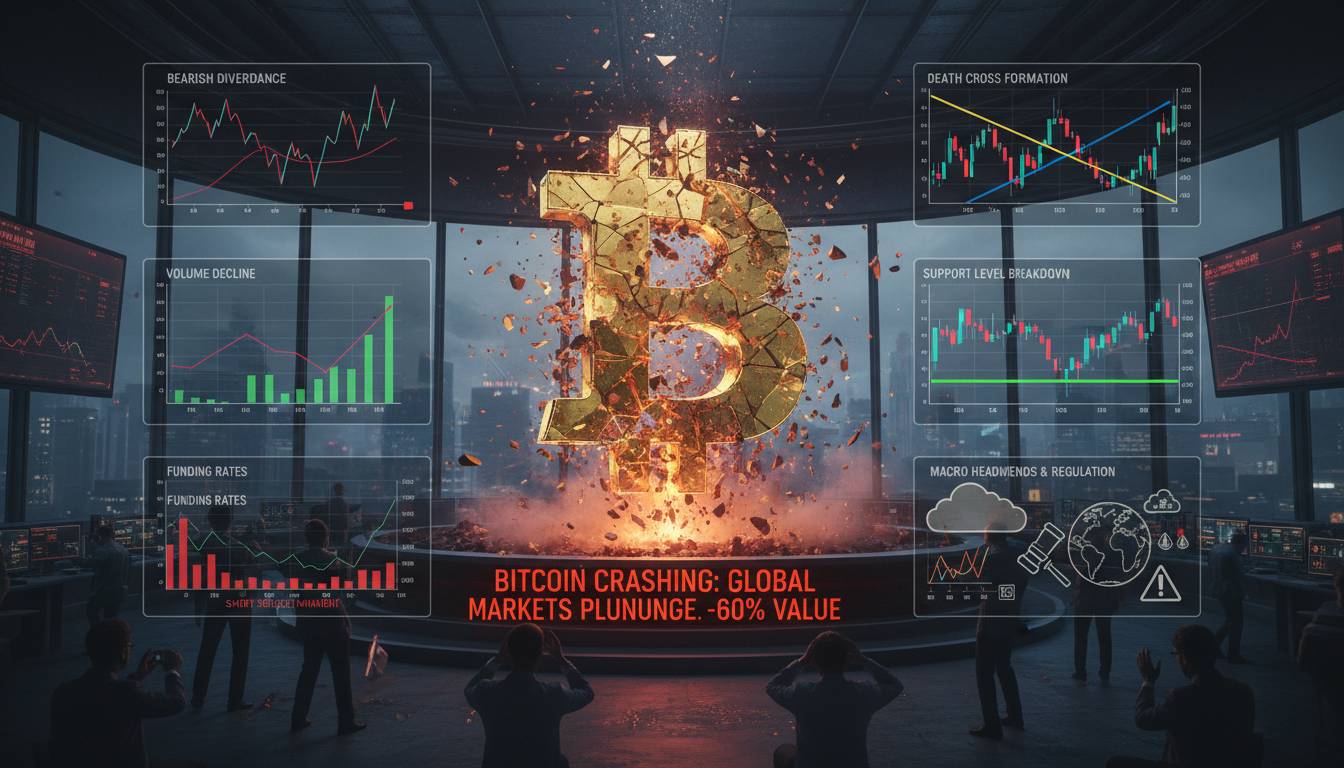
Every major Bitcoin top in history has left a trail of breadcrumbs — on-chain metrics, technical indicators, and sentiment readings that, in hindsight, screamed “exit.” These warning signs existed before the 2014 crash from $1,100 to $200, before the 2018 collapse from $20,000 to $3,200, and before the 2022 wipeout from $69,000 to $16,000. The indicators didn’t fail. The investors reading them did.
This isn’t an article predicting Bitcoin’s next crash. It’s something more useful: a breakdown of the five indicators that have consistently identified market extremes across every cycle, how they work, and what they currently signal. If you’re holding Bitcoin and haven’t looked at these metrics, you’re essentially driving with your eyes on the rearview mirror.
The Historical Pattern: Three Crashes, One Common Story
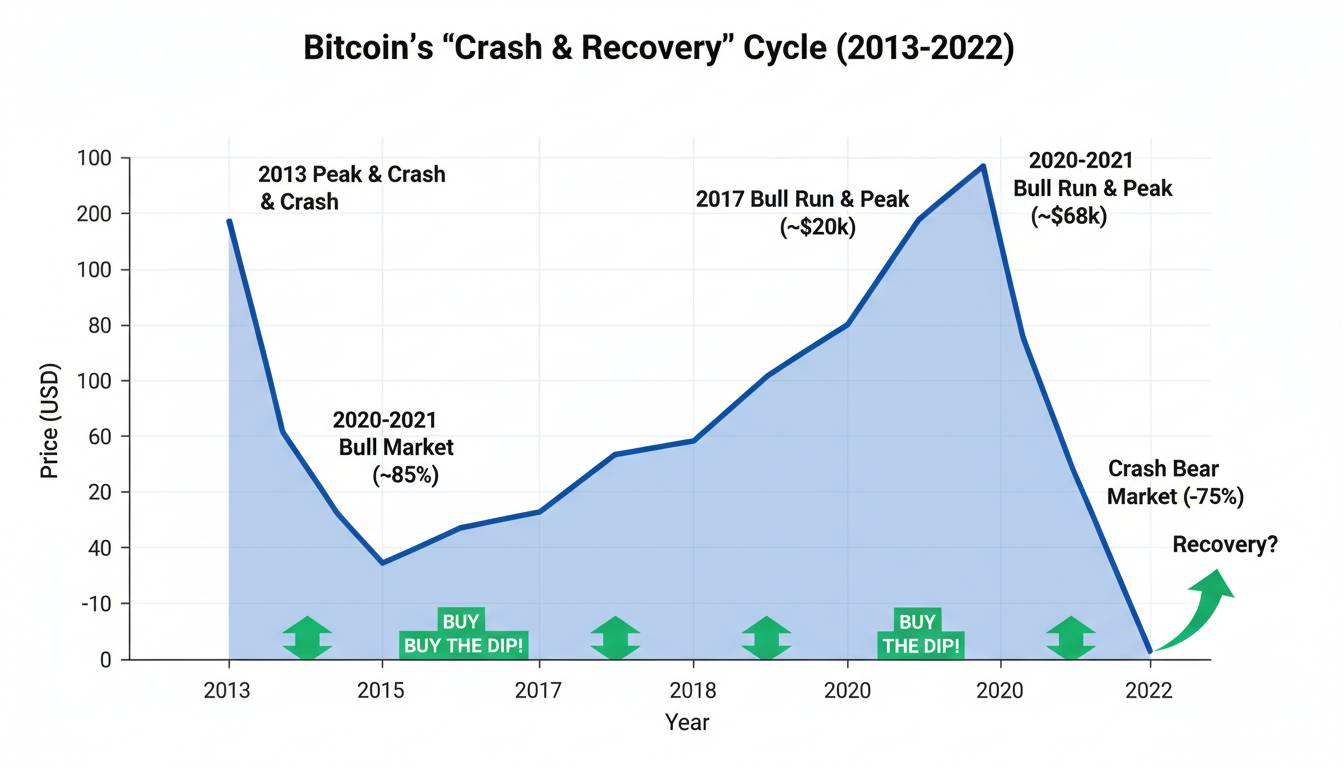
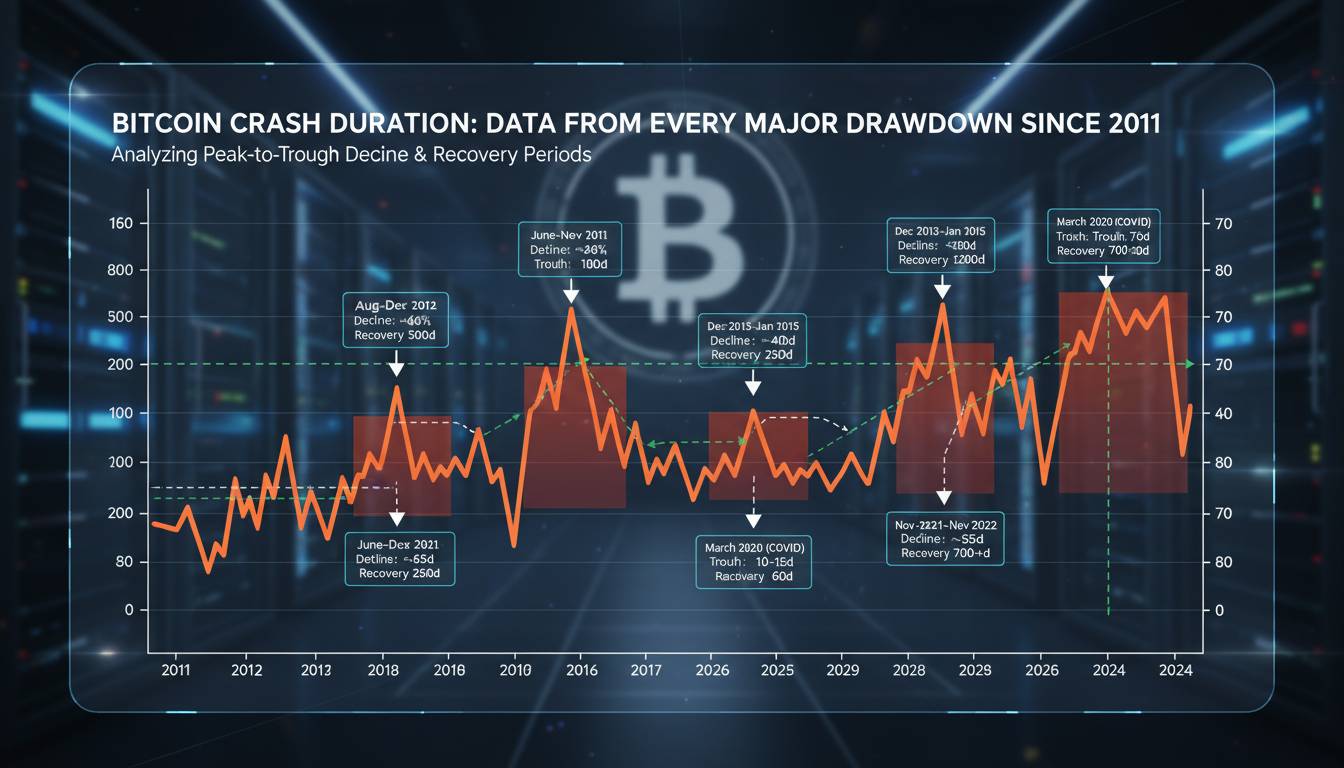
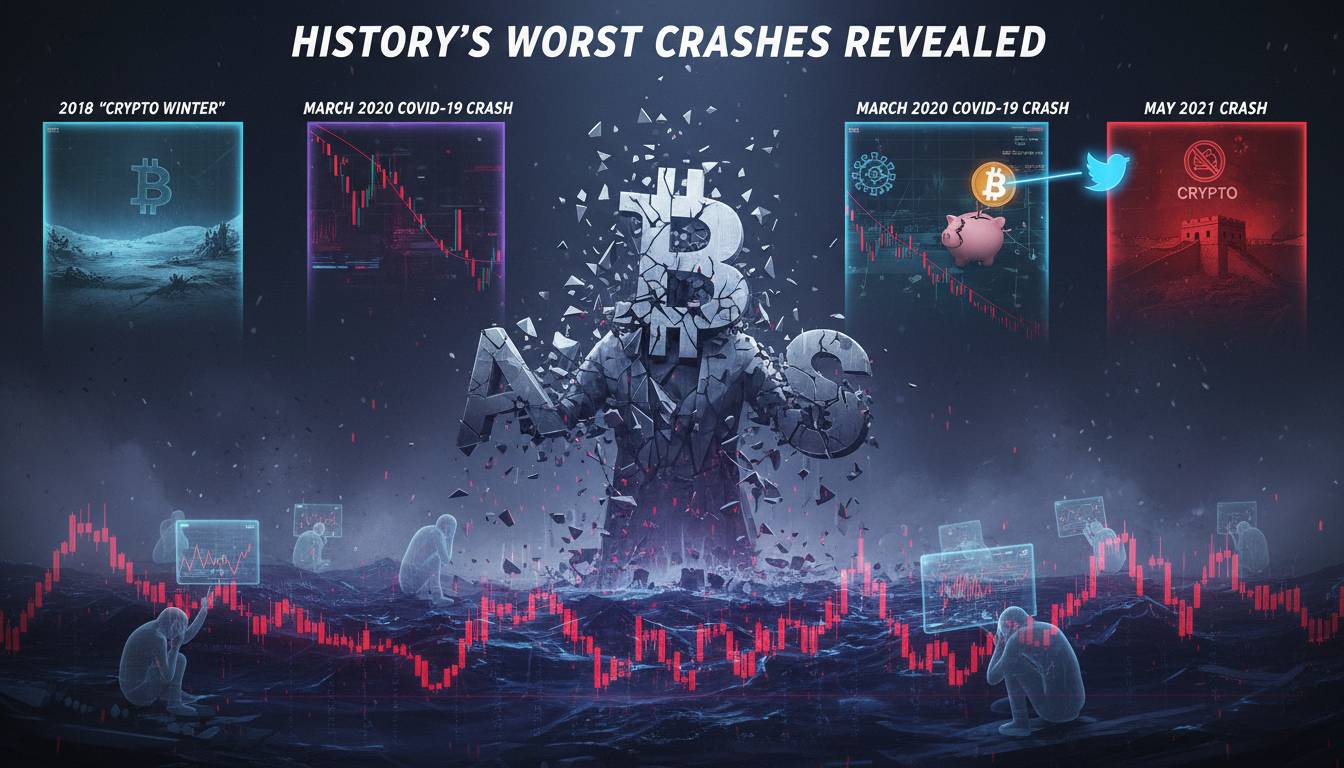
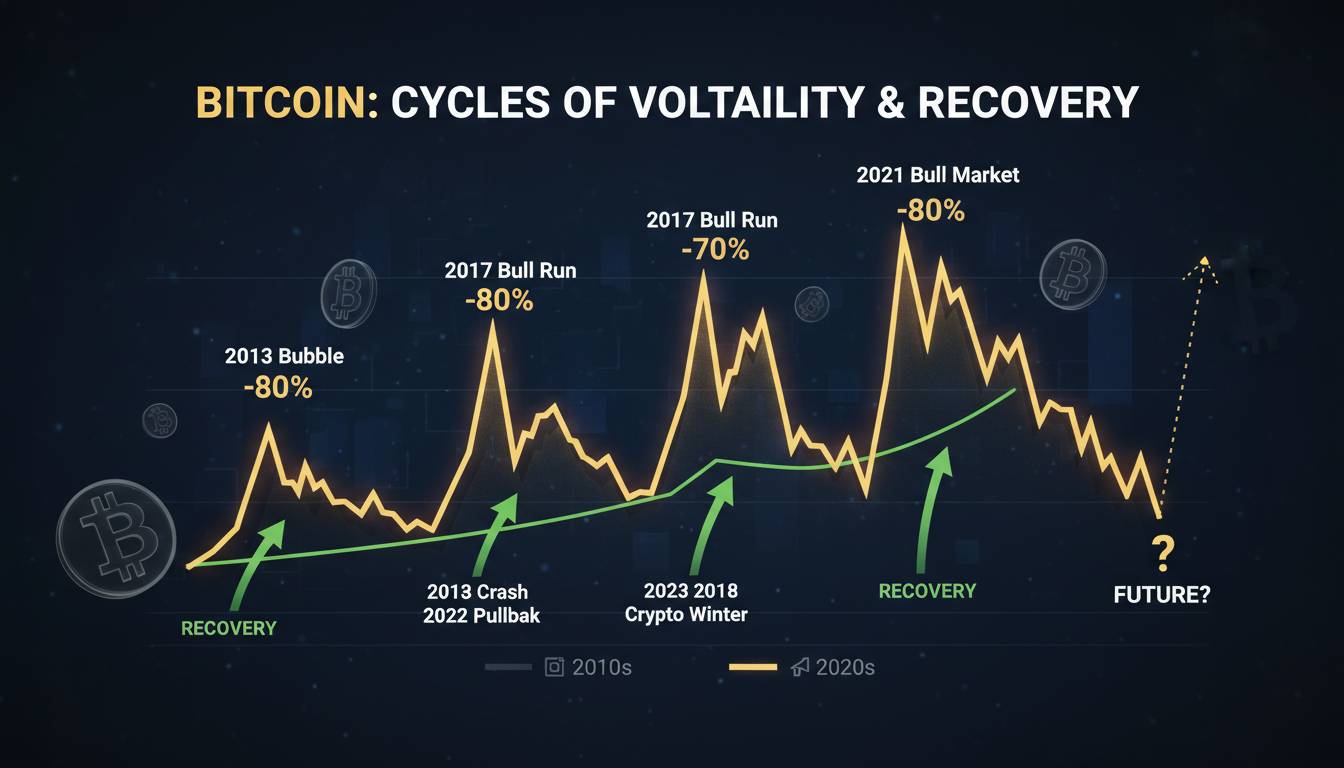
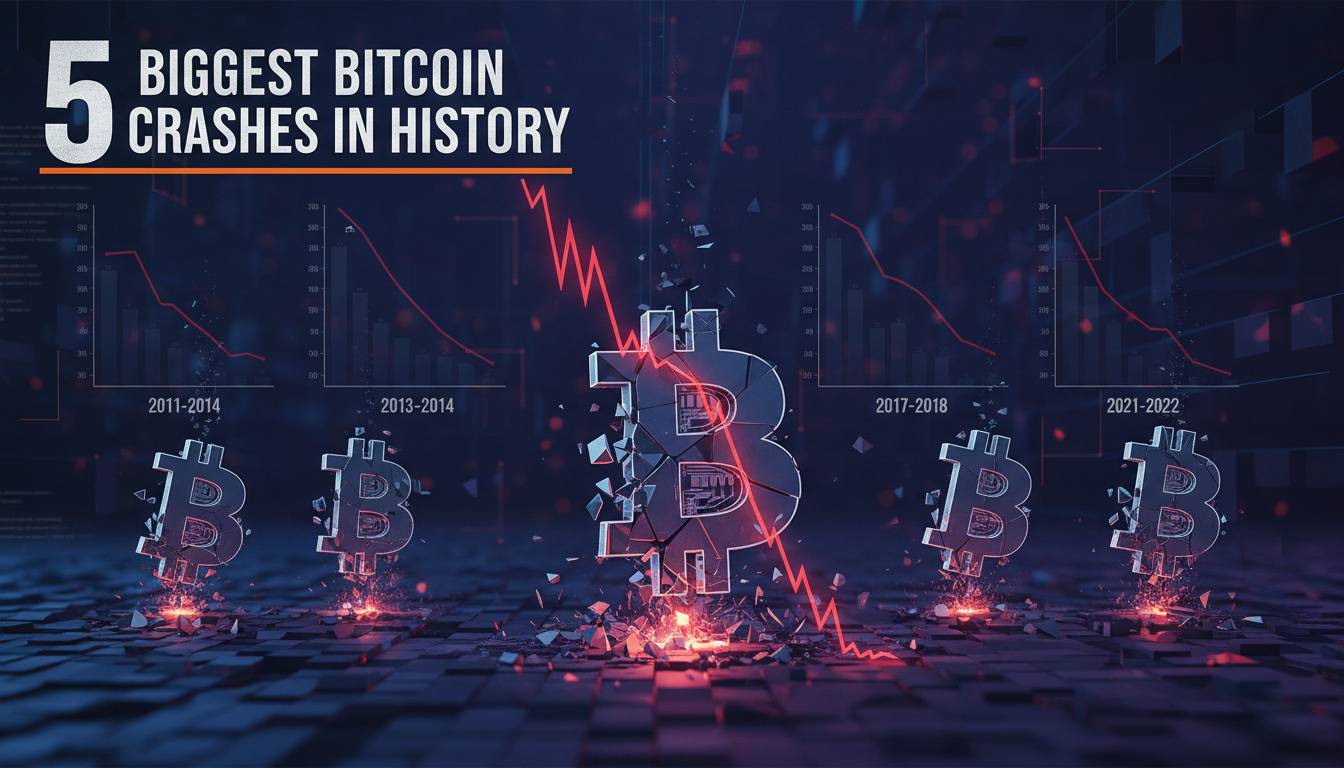
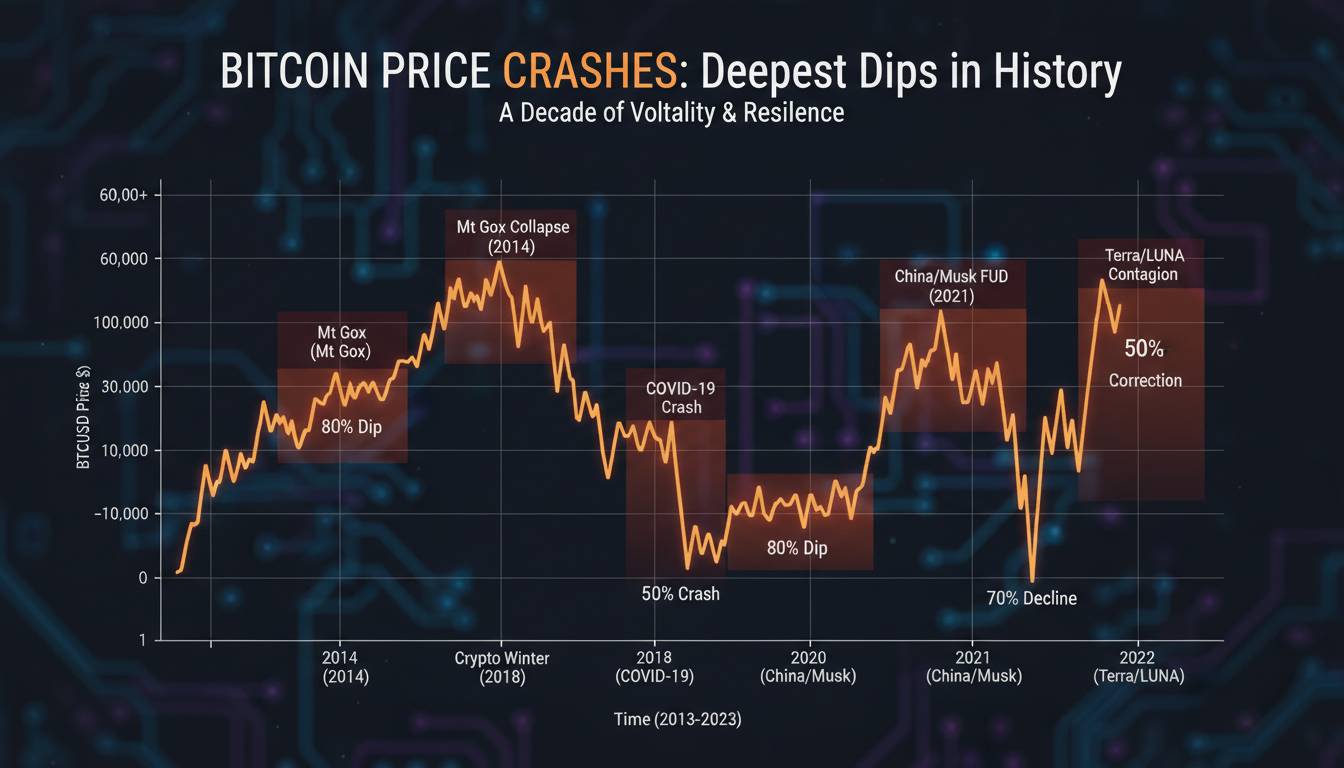
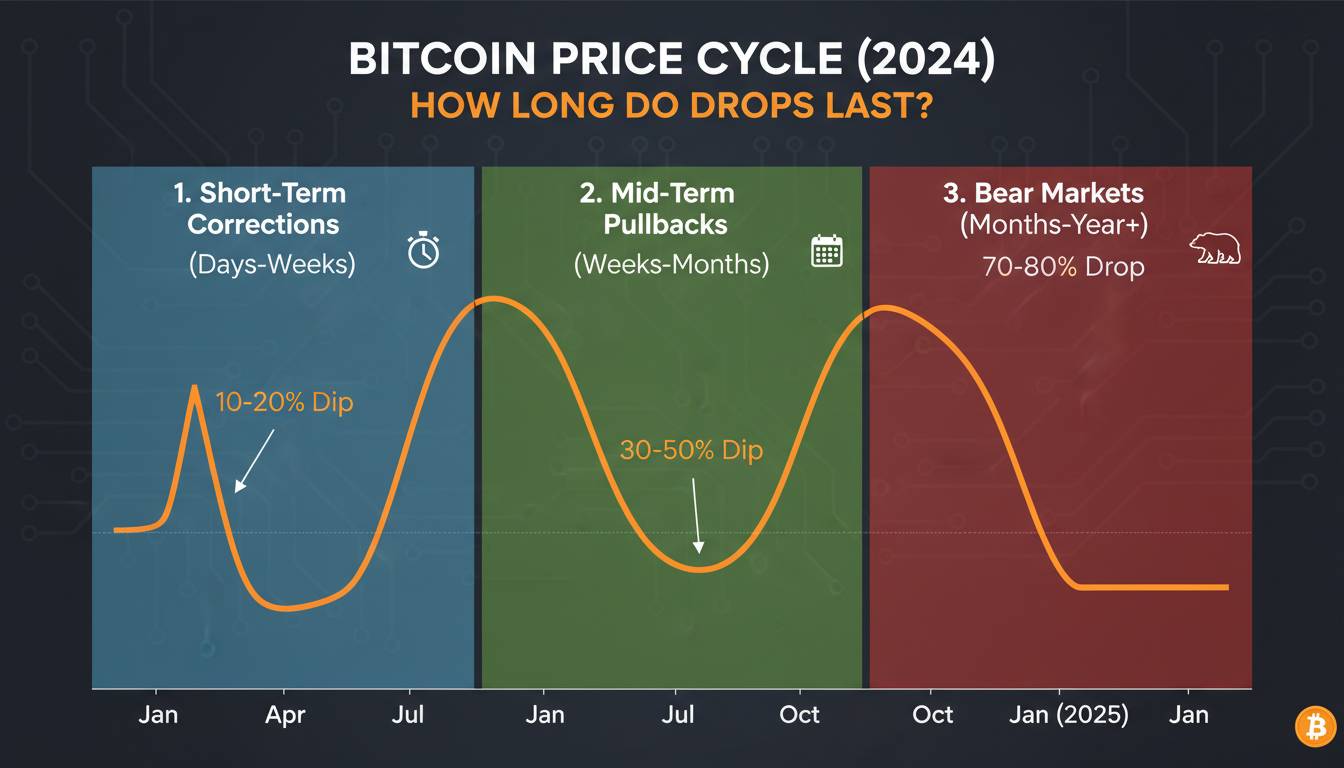
Bitcoin has experienced three distinct bear markets since it gained mainstream attention. Each followed a similar script: a parabolic rise, media frenzy, and then a devastating correction that wiped out 70-90% of the value. Understanding what happened in each cycle isn’t just historical curiosity — it’s the foundation for reading the indicators that matter.
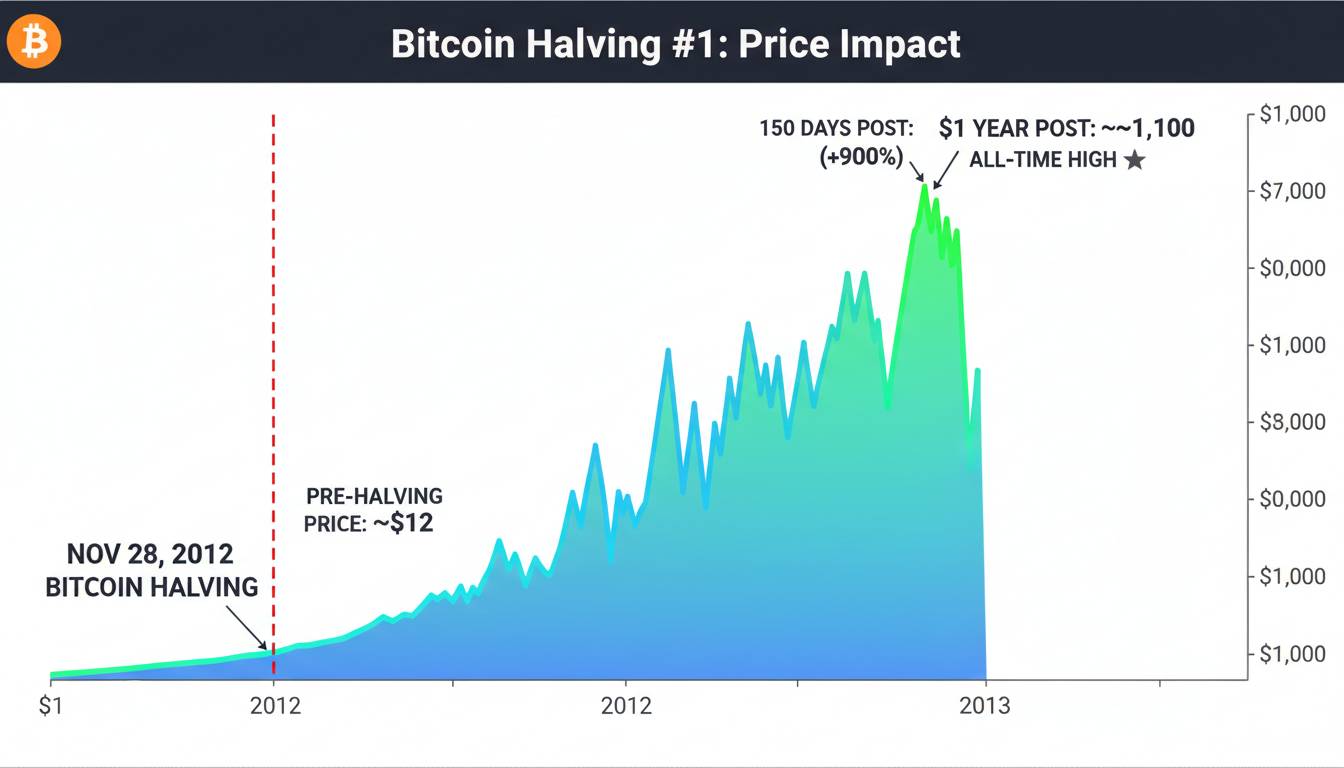
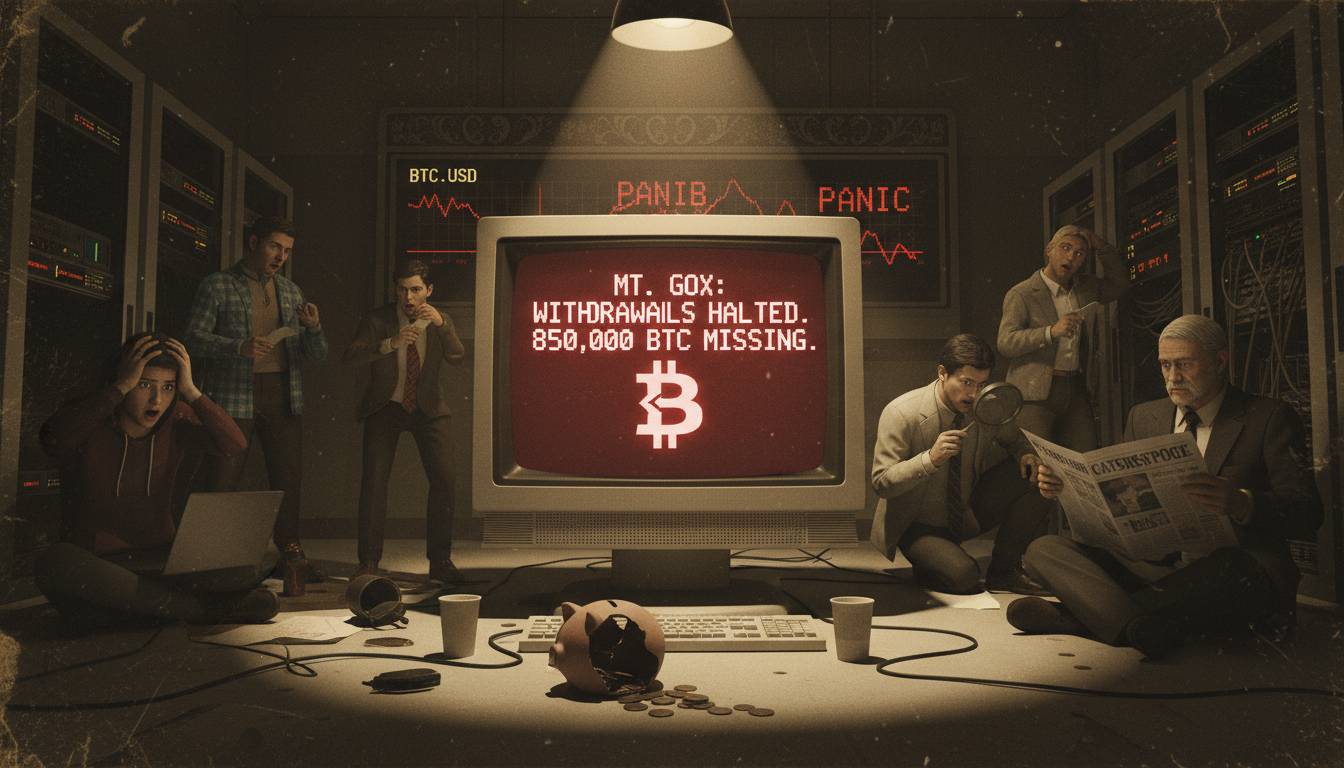
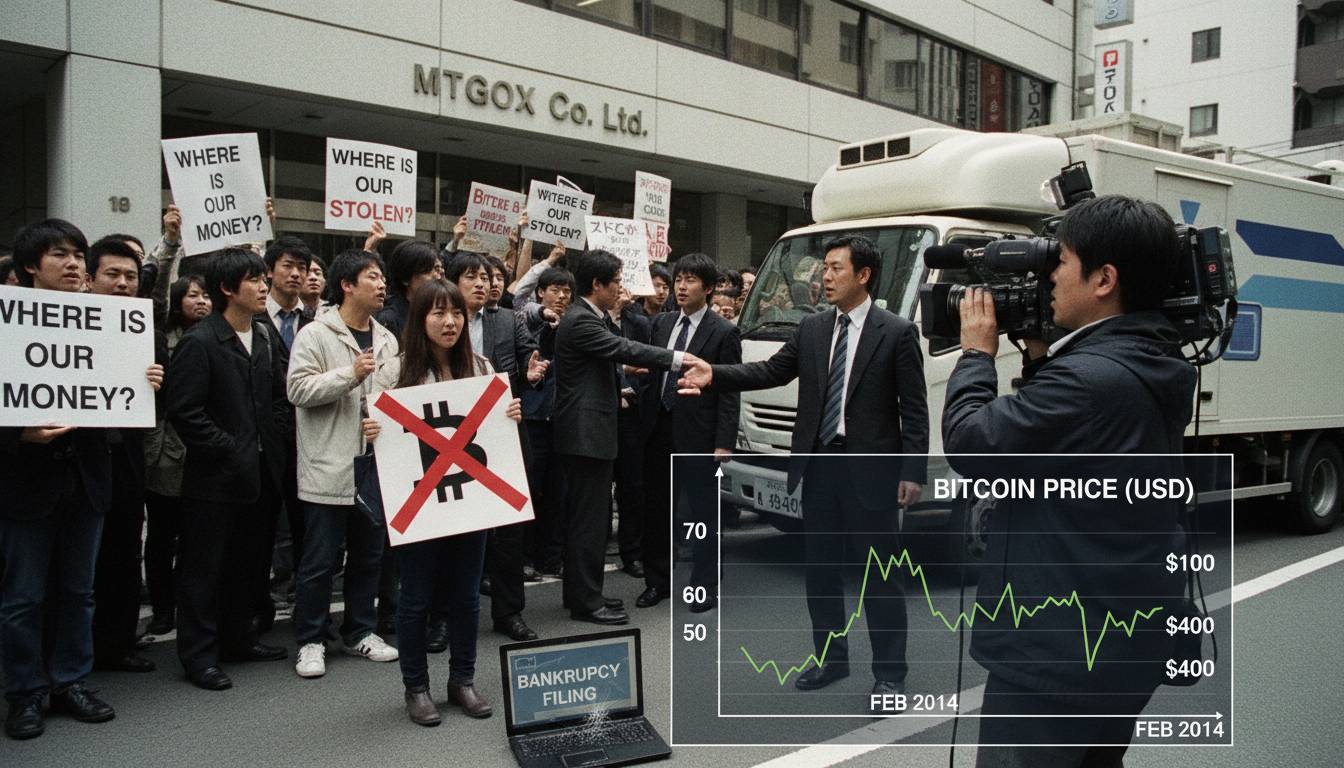
The 2014 crash followed the first major wave of mainstream adoption. Bitcoin climbed from under $100 in early 2013 to over $1,100 by late November. The crash that followed wasn’t immediate — Bitcoin lingered above $800 for months before collapsing to around $200 by early 2015. The total drawdown exceeded 80%. At the time, most analysts blamed the Mt. Gox collapse and regulatory uncertainty. But the on-chain data was already flashing warnings.
The 2018 crash was even more dramatic in percentage terms. Bitcoin rose from under $1,000 in September 2017 to nearly $20,000 by December, driven by the initial coin offering mania and retail FOMO. The subsequent collapse was brutal — Bitcoin fell to around $3,200 by December 2018, an 84% drawdown. This cycle saw the emergence of many of the on-chain indicators I cover below, and those who tracked them avoided the worst of the damage.
The 2022 crash was different in character but similar in mechanics. Bitcoin peaked at nearly $69,000 in November 2021, then entered a grinding bear market that culminated in a wave of corporate bankruptcies and a low around $16,000 in November 2022. The total drawdown was approximately 77%. This cycle proved that even sophisticated institutional players could ignore the warning signs and get wiped out.
What links all three crashes isn’t just the price action — it’s that specific indicators were screaming “top” weeks or months before the peak. The question isn’t whether these indicators work. The question is whether you’ll pay attention when they scream again.
Indicator 1: MVRV Ratio — The Most Reliable Bitcoin Top Predictor
The Market Value to Realized Value ratio, commonly called MVRV, is arguably the single most reliable indicator for identifying Bitcoin market tops. It’s calculated by dividing Bitcoin’s market cap by its realized cap — essentially measuring whether current prices are wildly out of line with the average price paid by all holders.
When MVRV exceeds 3.7, historical data shows Bitcoin is in bubble territory. When it pushes above 4 or higher, a top is typically within weeks or months. This isn’t theoretical — it worked in 2013, 2017, and 2021.
During Bitcoin’s 2017 peak, MVRV hit approximately 4.2 in early December, just before the top. It peaked around 4.4. The ratio had never been higher in Bitcoin’s history at that point. By March 2018, MVRV had dropped below 1.0, signaling that most holders were underwater and that capitulation had likely occurred.
In the 2021 cycle, MVRV exceeded 4.0 in mid-November — coinciding almost exactly with Bitcoin’s all-time high of $69,000. The indicator then crashed below 1.0 by early 2022, marking the point where most holders were sitting on losses.
MVRV is powerful because it accounts for lost coins and long-term holders in a way that simple price charts cannot. When realized cap is calculated, coins that haven’t moved in years are priced at the last time they moved. This creates a “real” average cost basis for the entire market. When market value远超 this real cost basis, you have a situation where almost everyone is in profit — and almost everyone eventually takes profit.
As of early 2025, MVRV has been hovering in the 2.0-2.5 range during recent rallies. That’s elevated compared to bear market levels but nowhere near the 3.7+ warning zone. The indicator currently suggests the market is in a state of moderate optimism rather than extreme bubble territory — but it’s worth watching closely because the transition from “cautiously bullish” to “dangerously optimistic” can happen faster than most expect.
MVRV isn’t perfect. It failed to predict the exact top in the 2013 cycles and can give false signals during extended consolidation periods. It’s also a lagging indicator — it confirms what has already happened rather than predicting what will happen. But as a tool for identifying when the market has reached an extreme, nothing else comes close.
Indicator 2: RSI Divergence — Classic Technical Analysis That Still Works
Relative Strength Index divergence is one of the most widely used technical indicators in trading, and for good reason: it works. RSI measures the magnitude and speed of price changes to identify overbought or oversold conditions. When Bitcoin makes a new high but RSI fails to confirm that high with a similar move, you have bearish divergence — a warning that momentum is waning even as price pushes higher.
This pattern appeared unmistakably before the 2021 top. Bitcoin made its final push from $60,000 to $69,000 over roughly two weeks in November 2021. During that same period, RSI on the weekly chart was making lower highs. The price was going up; the momentum was going down. That divergence preceded the crash that followed.
The same pattern played out in 2017. Bitcoin’s final leg from $10,000 to $20,000 in December happened on declining RSI divergence. Traders who were watching for this signal had weeks of warning before the top.
In 2014, the pattern was more complex because RSI analysis was less commonly applied to Bitcoin, but the same mechanics were present in the historical data. Price pushed to new highs while momentum indicators diverged.
The key to using RSI effectively is timeframe selection. Weekly RSI divergence at major tops is more reliable than daily signals, which can generate false positives during normal volatility. The most dangerous RSI readings occur when Bitcoin is making new all-time highs on declining momentum — that’s the classic recipe for a top.
Current RSI readings on the weekly chart have been fluctuating between 50 and 70 during 2024-2025 rallies. This is neutral territory — not overbought, not oversold. There’s no bearish divergence currently forming because Bitcoin hasn’t been making new highs. But when (and if) Bitcoin pushes to new highs in the future, RSI divergence will be the first indicator to watch. If price makes a new high above $80,000 while RSI stays below its 2024 peak, that’s your warning.
One limitation: RSI can remain in overbought territory for extended periods during strong bull markets. Saying “RSI is overbought, therefore crash coming” is a beginner mistake. The signal isn’t the overbought reading — it’s the divergence between price and momentum. That distinction matters enormously.
Indicator 3: SOPR — Revealing When Holders Start Panicking
The Spent Output Profit Ratio tracks whether Bitcoin holders are selling at a profit or a loss. When SOPR exceeds 1.0, it means the average seller is in profit. When SOPR falls below 1.0, the average seller is at a loss. This simple metric reveals capitulation dynamics with surprising accuracy.
At market tops, SOPR typically spikes above 1.15 or higher — indicating that almost everyone who wants to sell is selling at a massive profit. This is the point where “weak hands” are distributing to “strong hands.” The indicator then crashes below 1.0 during bear markets, signaling capitulation.
During Bitcoin’s 2021 top, SOPR spiked above 1.3 — an extremely high reading that indicated massive profit-taking by long-term holders. This was the distribution phase. The subsequent crash saw SOPR plunge below 0.9, indicating that sellers were finally capitulating at a loss.
The 2018 bottom was marked by SOPR dropping below 0.8, one of the lowest readings in Bitcoin’s history. This represented complete capitulation — holders were willing to sell at massive losses rather than wait any longer. Historically, those have been the points of maximum opportunity.
SOPR is valuable because it’s real-time. Unlike some indicators that require weeks of data to confirm a pattern, SOPR updates daily. During the March 2020 crash, SOPR dropped below 0.8 within days of the bottom, providing a clear signal that capitulation had occurred even as the price was still falling.
Current SOPR readings have been hovering around 1.05-1.10 during recent trading activity. This indicates moderate profit-taking but nothing resembling the extreme readings seen at previous tops. The market appears to be in a state of healthy distribution rather than panic selling or euphoric profit-taking.
The limitation with SOPR is that it doesn’t distinguish between small-scale individual sellers and large institutional distributions. A spike above 1.0 could represent thousands of small retail transactions or a single whale moving coins. Context matters — looking at SOPR alongside exchange flow data helps distinguish between retail capitulation and institutional rebalancing.
Indicator 4: NUPL — Measuring Emotional Extremes Across the Market
Net Unrealized Profit/Loss measures the percentage of Bitcoin’s market cap that is in profit versus in loss. It’s expressed as a ratio where positive values indicate the market is overwhelmingly profitable, and negative values indicate the market is predominantly at a loss.
Historically, NUPL values above 0.75 have coincided with major tops. At those levels, almost every holder is in profit, and there’s essentially no one left to buy. The selling pressure becomes overwhelming because everyone who wanted to own Bitcoin already does. During the 2017 top, NUPL peaked at approximately 0.77. During the 2021 top, it reached similar extremes around 0.75-0.80.
Conversely, NUPL values below 0.25 — and especially below 0.0 — have marked major bottoms. When the market is predominantly at a loss, capitulation has occurred, and new buyers enter at attractive prices. The March 2020 crash drove NUPL into negative territory briefly, marking one of the best buying opportunities in Bitcoin’s history.
NUPL captures emotional extremes across the entire holder base. It answers a simple question: is the market feeling greedy or fearful? When NUPL is at extremes, the answer is obvious — and the crowd’s consensus has historically been wrong at those exact moments.
As of early 2025, NUPL has been fluctuating between 0.4 and 0.5 during Bitcoin’s more active periods. This suggests a market where a majority of holders are in profit, but not at the extreme levels seen at previous tops. There’s still room for optimism without reaching bubble territory.
A counterintuitive point about NUPL: it’s possible for Bitcoin to remain in “overvalued” territory for longer than most expect. The indicator can stay elevated for months during extended bull runs. Trying to time a top based solely on NUPL reaching a certain level will likely result in exiting too early. The indicator works best as a confirmation tool rather than a leading indicator — when you see extreme NUPL readings combined with other warning signs, the probability of a top increases dramatically.
Indicator 5: The Fear & Greed Index — Crowd Psychology at Its Finest
The Fear & Greed Index aggregates multiple data sources — including volatility, market momentum, social media activity, and surveys — into a single number from 0 to 100. Scores below 25 indicate extreme fear; scores above 75 indicate extreme greed. The index has become one of the most widely cited metrics for Bitcoin market sentiment, and its track record at identifying tops and bottoms is remarkable.
At every major Bitcoin top in history, the Fear & Greed Index has spiked above 80 — sometimes into the 90s. During the 2021 peak, the index remained in “extreme greed” territory for weeks before the crash. The same pattern played out in 2017. The crowd was euphoric right before the music stopped.
At market bottoms, the index drops into single digits. The March 2020 crash saw Fear & Greed plunge to 8 — one of the lowest readings ever. The November 2022 bottom similarly saw readings in the low teens. These were the moments when everyone was terrified, when the headlines screamed about Bitcoin’s death, and when the rational move was to accumulate.
The index isn’t sophisticated technical analysis — it’s crowd psychology made simple. And that’s exactly why it works. Markets top when there’s no one left to buy. The Fear & Greed Index measures that dynamic directly: when everyone is greedy, who’s left to buy? When everyone is fearful, who’s left to sell?
Current readings have been oscillating between 50 and 70, corresponding with Bitcoin’s price action. This is the “neutral” zone — not extreme fear, not extreme greed. The market appears cautious rather than euphoric. That’s meaningful context for understanding where we might be in the cycle.
The uncomfortable truth about the Fear & Greed Index: it tells you what the crowd is feeling, but not when the feeling will change. You can have “extreme greed” persist for weeks or months before a correction. The index is most useful as a contrarian indicator — when everyone is greedy, that’s when you become cautious. When everyone is fearful, that’s when you look for opportunities. But actually executing on that knowledge requires discipline most investors lack.
What the Indicators Are Saying Right Now
Looking at the current landscape in early 2025, here’s an honest assessment of where these five indicators stand:
MVRV is elevated but not at extreme levels. The ratio has been climbing but remains below the 3.7 warning threshold that historically signals bubble territory. RSI shows no bearish divergence because Bitcoin hasn’t made new highs. SOPR indicates moderate profit-taking but nothing resembling the distribution seen at previous tops. NUPL suggests a majority of holders are in profit, but not at extreme levels. Fear & Greed Index readings are in the neutral range.
The aggregate picture is NOT one of extreme bubble territory. This doesn’t mean Bitcoin can’t crash — it absolutely can, for reasons unrelated to these indicators. But based on the five metrics that have historically predicted every major top, the market is not currently at the point of maximum danger.
That’s actually useful information regardless of your position. If you’re holding Bitcoin, you’re not in the “sell everything” zone. If you’re looking to buy, you’re not at the “capitulation bottom” zone either. The indicators suggest the market is somewhere in the middle of a cycle — potentially early-to-mid bull run rather than late-stage mania.
But what keeps experienced traders awake at night: these indicators can flip to extreme faster than anyone expects. Bitcoin’s nature is to spend long periods in boring ranges followed by brief periods of parabolic moves. The transition from “moderately bullish” to “dangerously optimistic” can happen in weeks.
The Honest Reality: Indicators Don’t Predict the Future — They Define Probabilities
I want to be clear about what these indicators can and cannot do. They cannot predict when a crash will happen. They cannot tell you the exact top or bottom. They cannot account for black swan events — regulatory bans, technological failures, or macroeconomic shocks that move markets for reasons unrelated to on-chain data.
What they can do is define probabilities. When all five indicators are flashing extreme warnings, the probability of a significant correction is very high. When all five are showing capitulation, the probability of a bottom is high. When they’re mixed or neutral, the probability of a significant move in either direction is lower — but the market will find ways to surprise you regardless.
The traders who have navigated multiple Bitcoin cycles successfully aren’t the ones who predict the future. They’re the ones who manage risk when the indicators line up against them, who stay humble when the indicators are neutral, and who position themselves appropriately rather than gambling on precise timing.
The question “Will Bitcoin crash again?” misses the point. Bitcoin will crash again — it always has. The more useful question is: will the indicators warn you before it happens? And that answer depends entirely on whether you’re paying attention to the data rather than the headlines.
The next major crash will leave the same breadcrumbs as every previous crash. The question is whether you’ll recognize them when you see them.