
Bitcoin has always been an asset that defies simple narratives. By 2026, the cryptocurrency will have navigated its fourth halving cycle, absorbed significant institutional capital flows, and faced whatever macroeconomic turbulence lies ahead. The question isn’t whether Bitcoin will matter — it clearly will — but what the data actually suggests about its trajectory. This analysis examines three distinct analytical frameworks: macroeconomic indicators, on-chain metrics, and technical patterns. Each tells a different story. Together, they paint a picture far more nuanced than the simple “to the moon” or “collapse to zero” narratives that dominate public discourse.
The exercise requires intellectual honesty: these frameworks sometimes contradict each other. A prudent analyst doesn’t force consensus where none exists. What follows is an attempt to lay out what the data actually shows, where the signals are strong, and where genuine uncertainty remains.
Macroeconomic Environment: The Institutional On-Ramp
The macro case for Bitcoin in 2026 rests on several interlocking ideas: continued inflation hedging demand, sovereign wealth accumulation, and the growth of exchange-traded product infrastructure. Each deserves scrutiny.
Interest Rates and Monetary Policy
The Federal Reserve’s policy trajectory from 2024 through 2025 will shape Bitcoin’s attractiveness relative to fixed-income assets. If rates decline from their 2023-2024 elevated levels — as many economists projected by late 2024 — the opportunity cost of holding a non-yielding asset like Bitcoin decreases. Historical correlation between real yields and Bitcoin performance isn’t perfectly consistent, but periods of monetary easing have generally coincided with stronger Bitcoin price action.
However, the idea that Bitcoin automatically benefits from rate cuts deserves skepticism. During the 2019-2020 period, Bitcoin rallied significantly before the COVID crash, but the subsequent recovery came alongside massive fiscal stimulus rather than purely monetary easing. By 2026, the relationship between Federal Reserve policy and Bitcoin may be more tied to risk asset sentiment generally than through any direct mechanical link.
The bigger story is the potential for sovereign wealth funds to allocate to Bitcoin. Several nations — including Bhutan, El Salvador’s continued accumulation, and various sovereign wealth vehicles — have already made moves. A single large sovereign allocation in 2025 or 2026 would represent a structural demand shift unlike anything in Bitcoin’s history. I don’t have specific intelligence on which nations might act, but the possibility represents a tail-risk scenario for prices that didn’t exist in previous cycles.
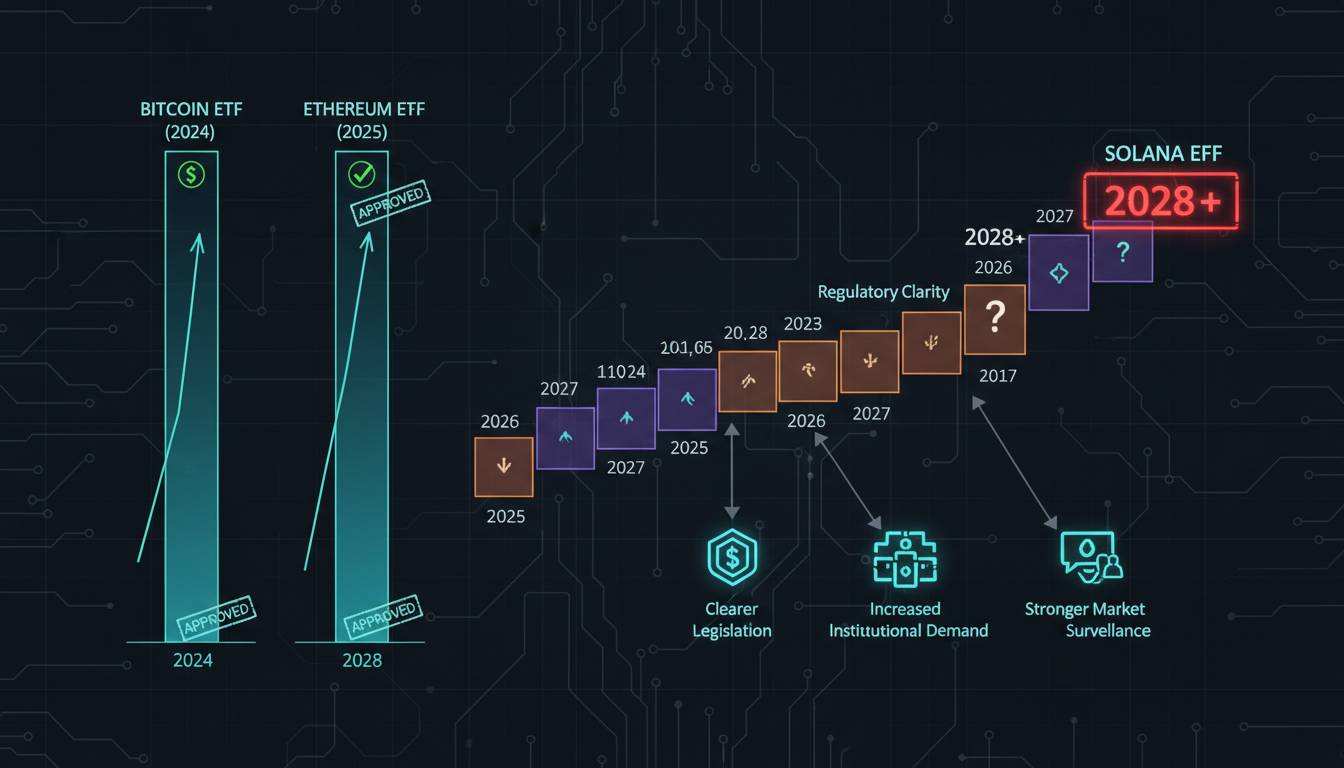
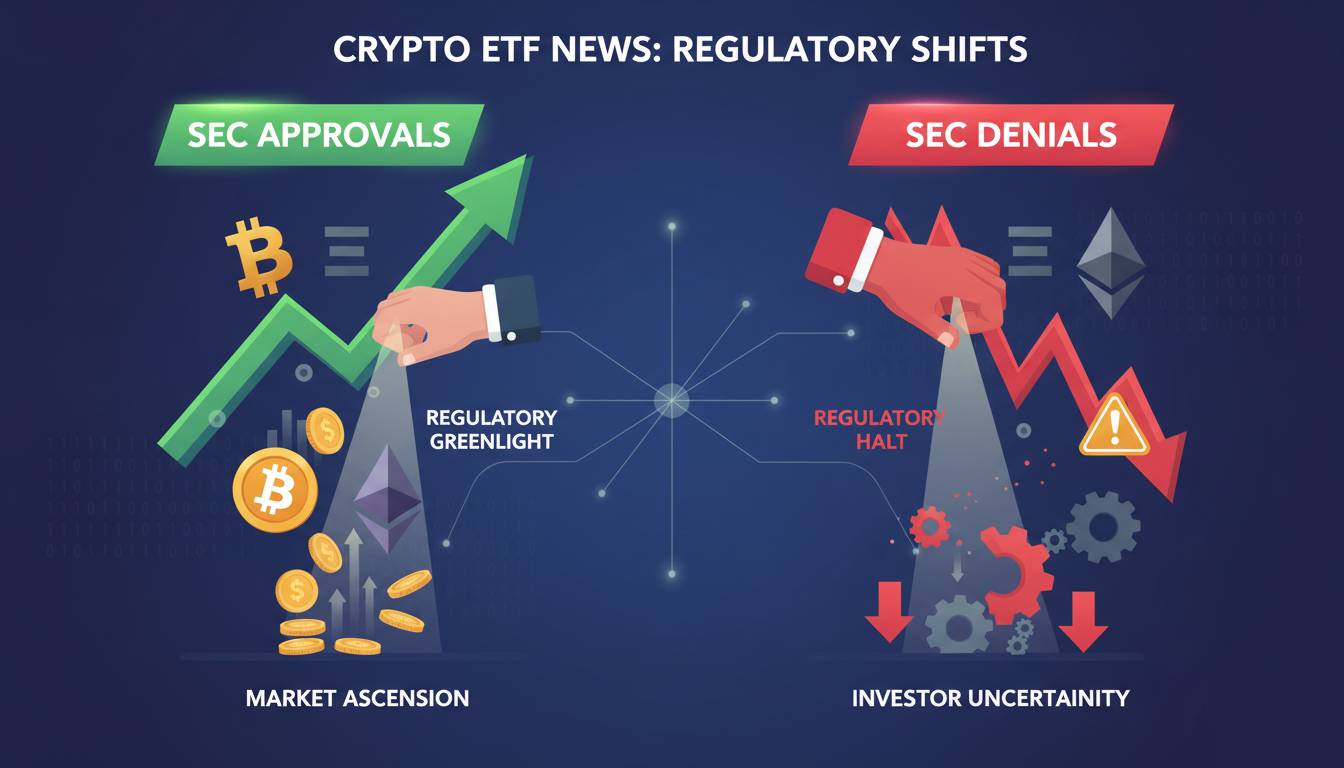
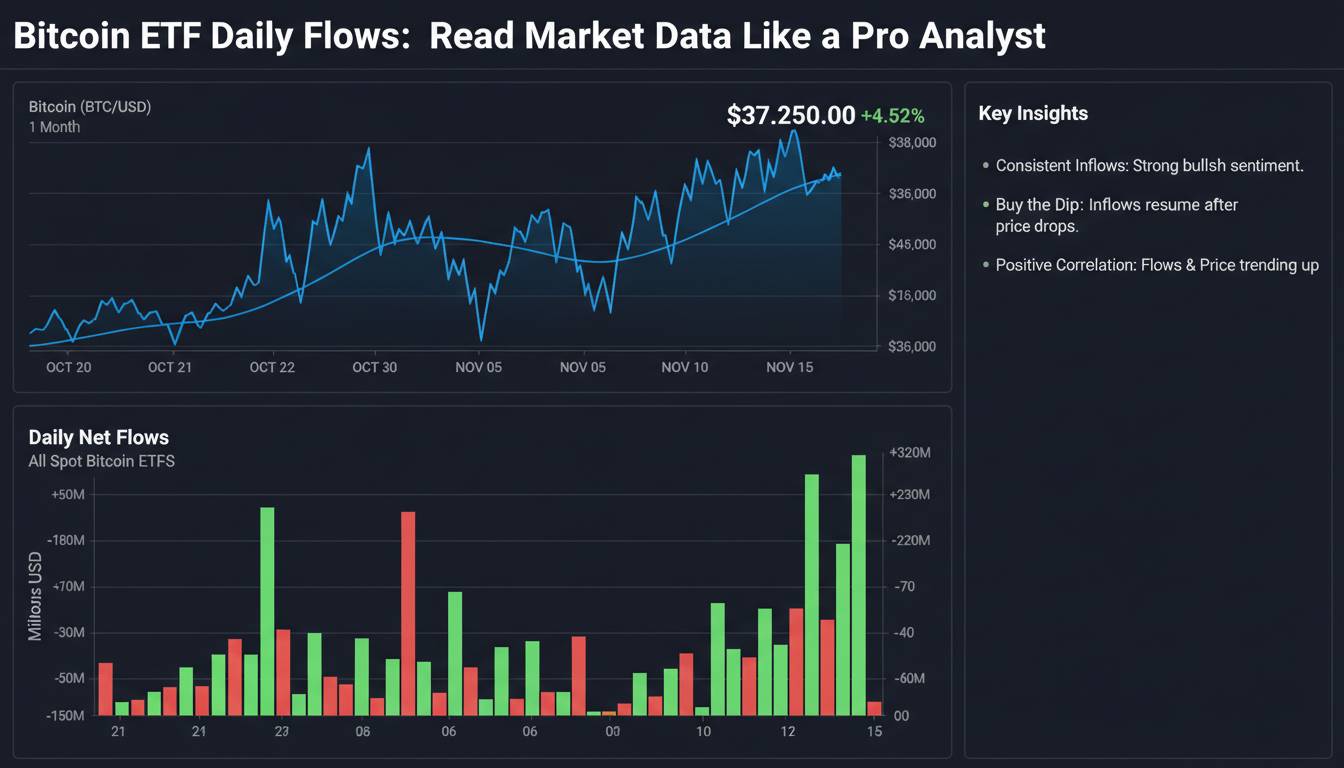
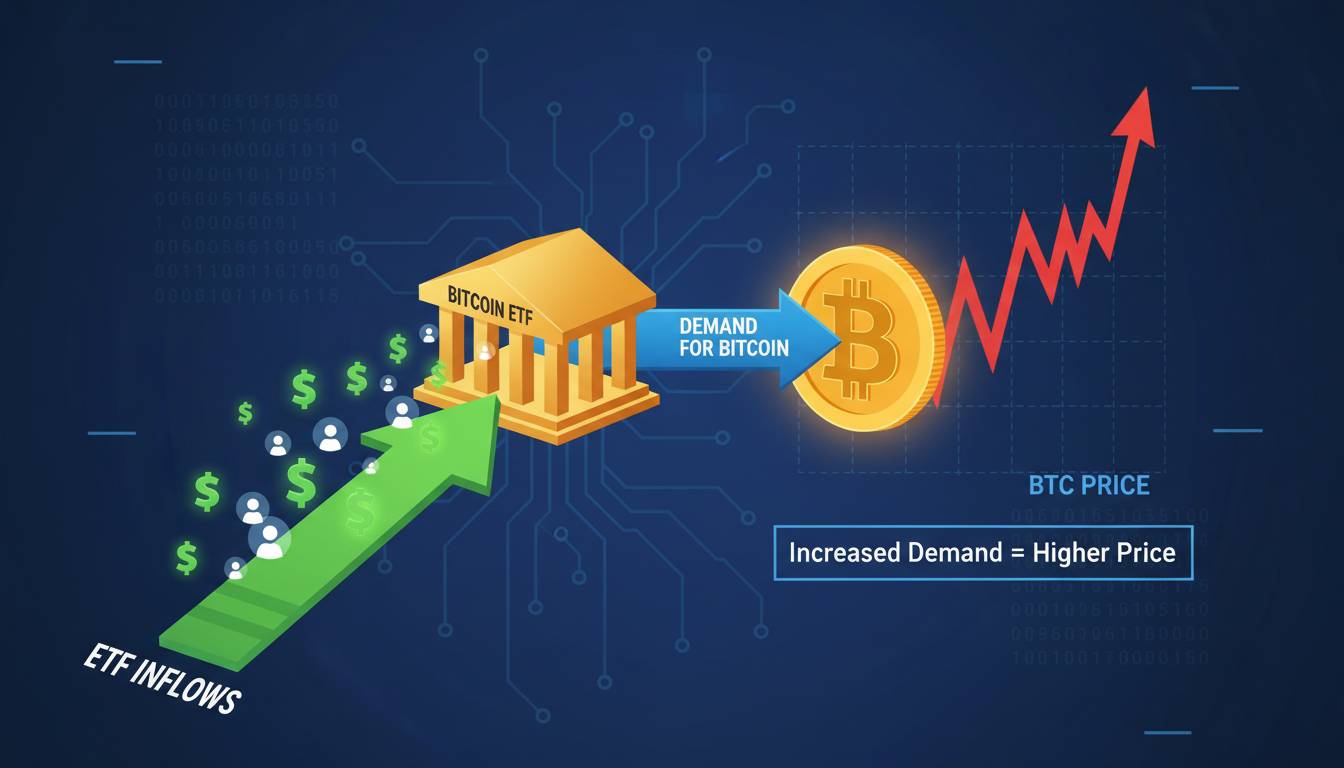
ETF Flows and Institutional Adoption
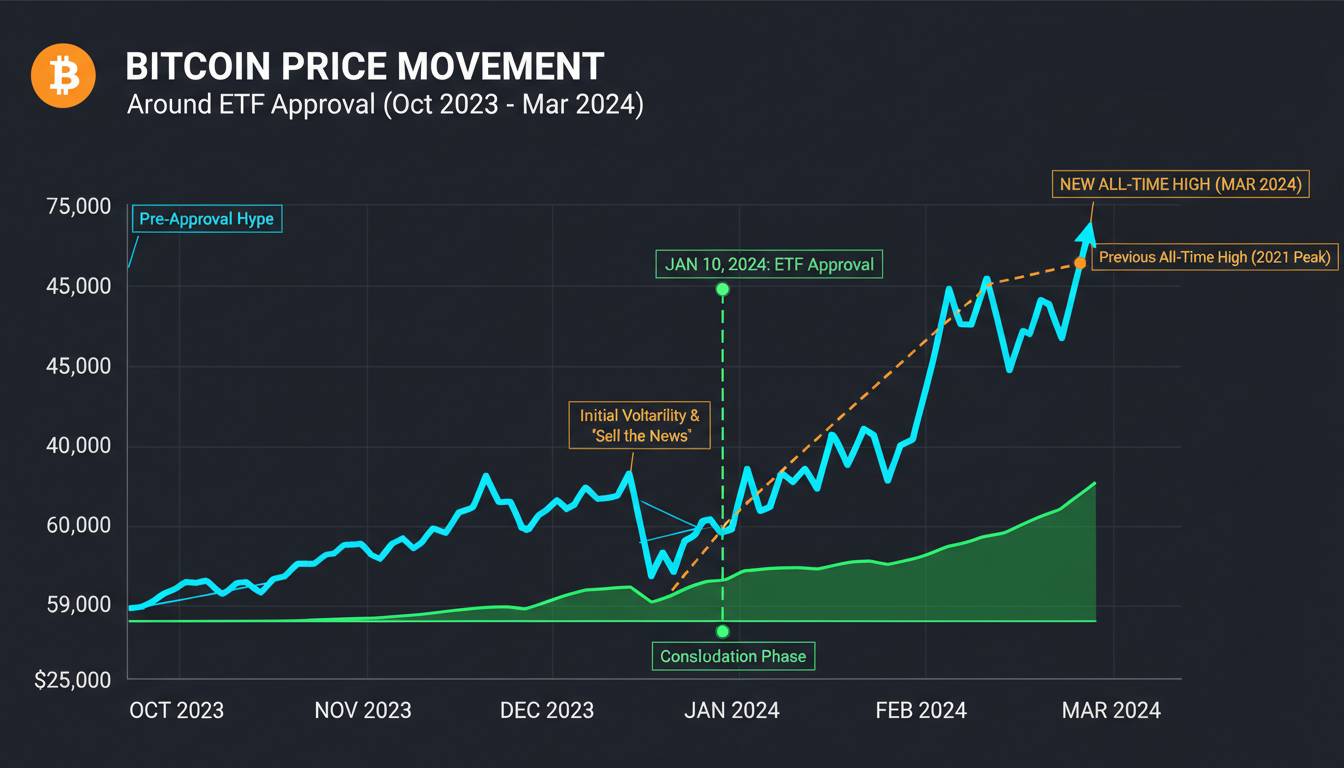
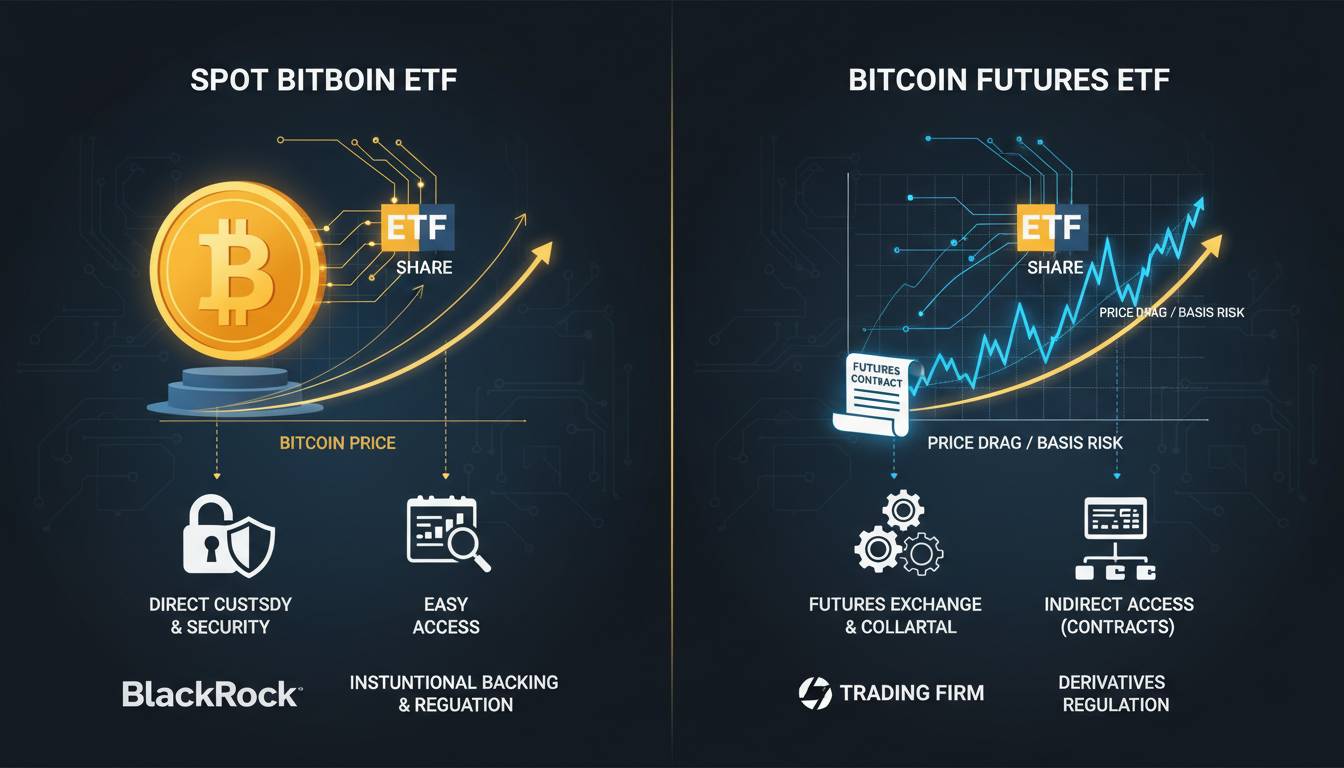
The approval of spot Bitcoin ETFs in the United States in January 2024 changed the investment landscape for Bitcoin. These products have generated tens of billions of dollars in net inflows since launch, with BlackRock’s IBIT and Fidelity’s FBTC commanding significant market share. By 2026, the cumulative effect of these flows will be substantial — both in terms of price support and in establishing Bitcoin as a mainstream allocation for wealth managers.
The change is cultural as much as financial. Financial advisors who previously couldn’t recommend Bitcoin due to custody and regulatory concerns can now allocate through familiar brokerage platforms. This changes the investor base from predominantly speculative retail to a more durable holder base. That doesn’t guarantee higher prices, but it does suggest reduced volatility and different demand elasticity than in prior cycles.
Yet there’s a countervailing factor worth acknowledging: ETF flows can reinforce bull markets but also reverse in bear markets. The same institutional infrastructure that enables inflows also enables orderly exits. The idea that ETFs create “permanent” demand overlooks how sophisticated institutional allocators are — they’ll rebalance based on performance relative to other assets.
Global Adoption and Currency Dynamics
The “digital gold” narrative has proven durable, but its strength varies with geopolitical circumstances. Countries experiencing currency instability — Turkey, Argentina, Nigeria, and others — continue to see Bitcoin usage as a hedge against local monetary conditions. This organic demand base provides a floor that didn’t exist in earlier cycles when Bitcoin was predominantly traded by investors in developed markets.
The competition with other store-of-value assets matters. If gold continues its 2020s strength, Bitcoin benefits from the same macro conditions while potentially capturing a portion of the allocation shift from younger investors who view Bitcoin more favorably than gold. The inverse is also true: if gold enters a prolonged correction, Bitcoin’s correlation with precious metals could weigh on prices.
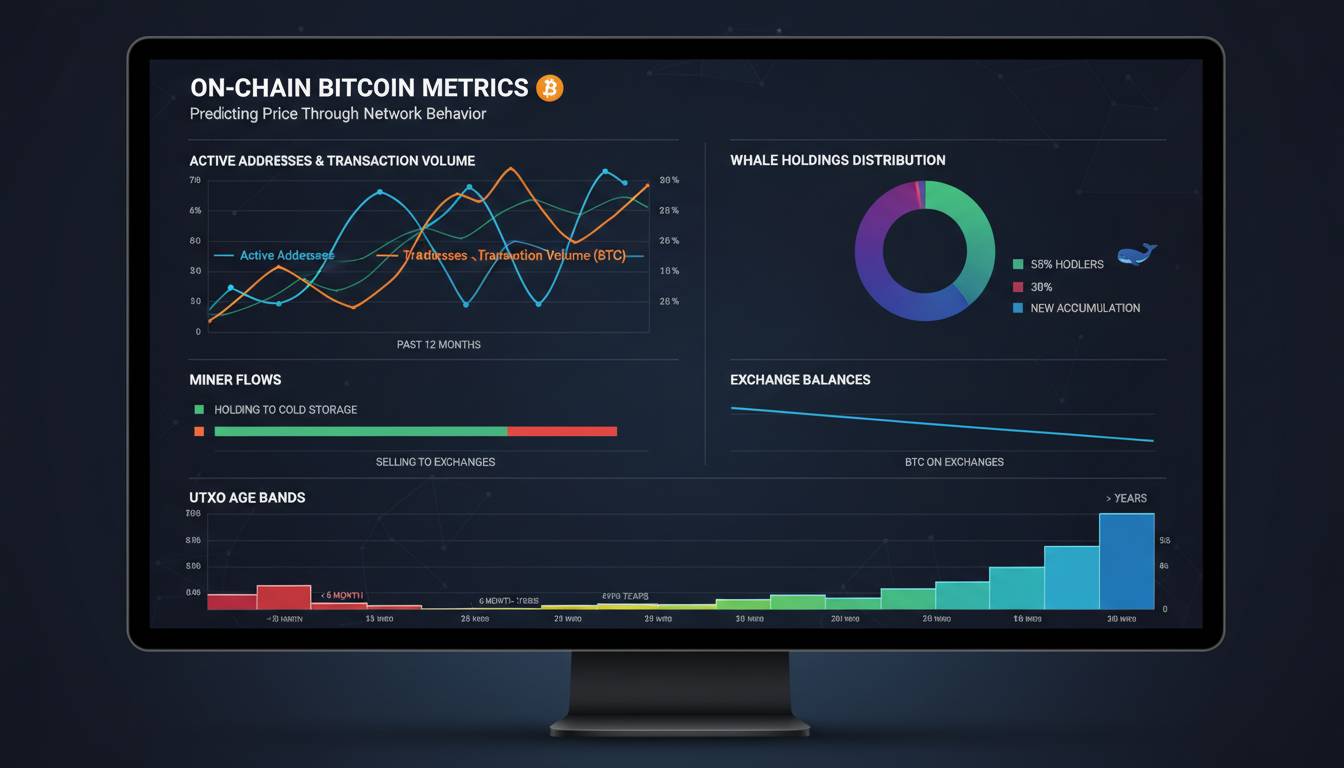
On-Chain Metrics: The Supply-Side Story
On-chain data provides a window into Bitcoin’s network health that price charts alone cannot capture. Several key metrics suggest structural support for higher prices, though each comes with important caveats.
HODL Waves and Holder Distribution
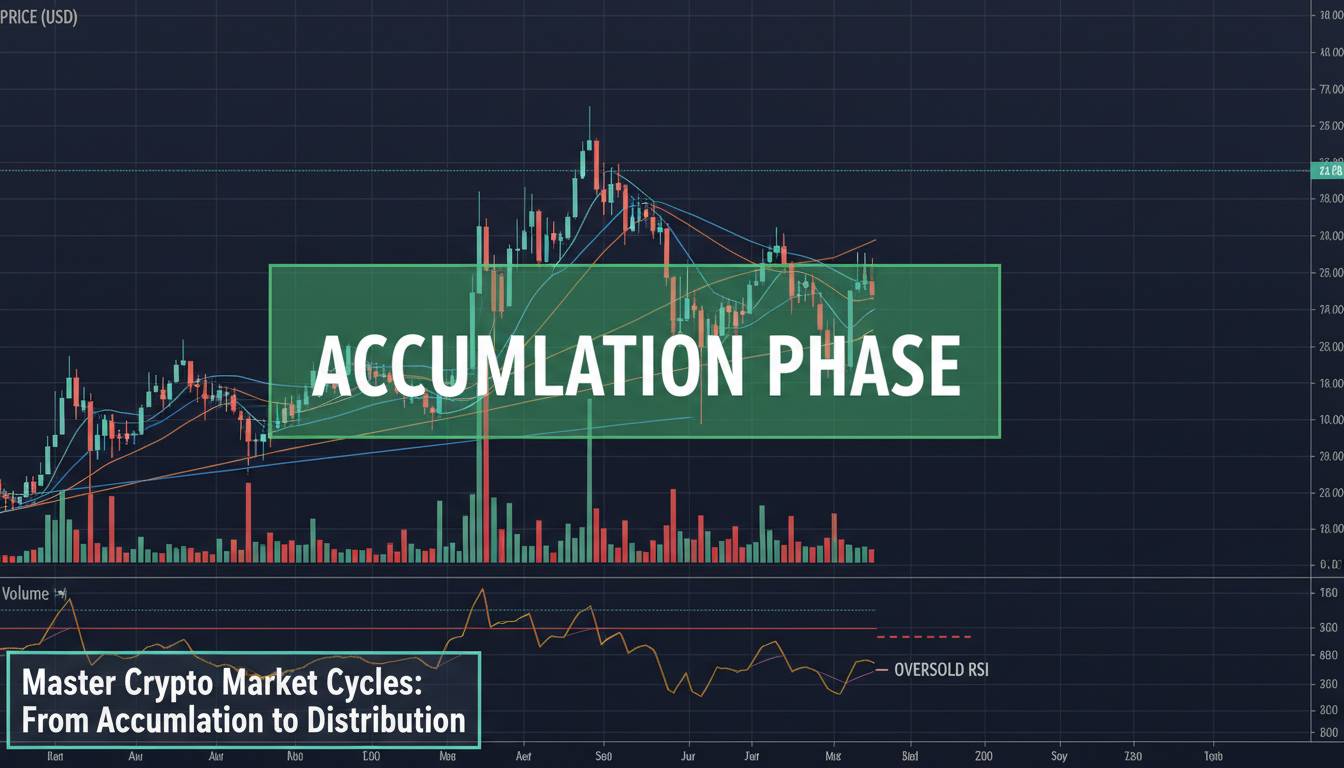
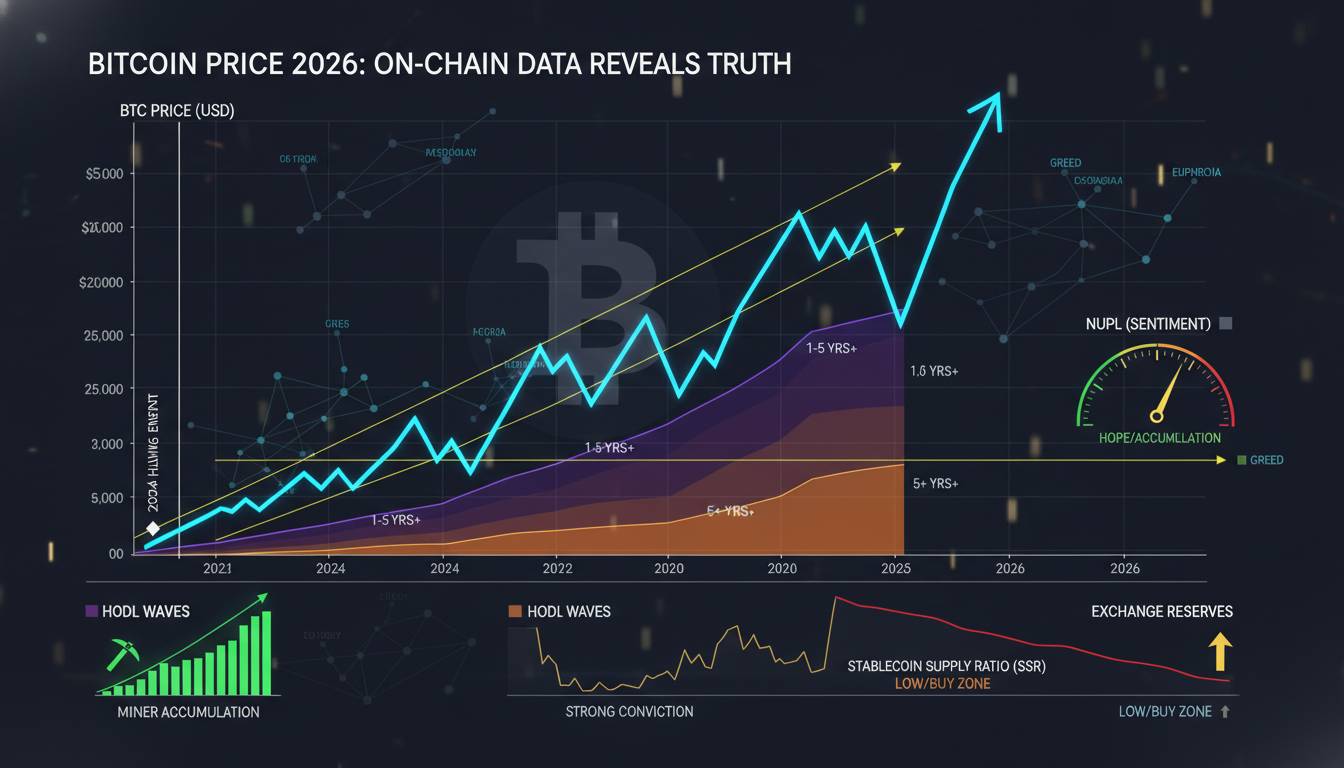
The HODL wave metric, originally developed by Glassnode and now tracked across multiple analytics platforms, measures the percentage of Bitcoin supply that hasn’t moved in specific time horizons. What stands out in the 2023-2024 period is the sustained accumulation among long-term holders. Despite price appreciation, the supply held by addresses older than one year continued climbing — a pattern consistent with previous cycle bottoms.
By 2026, the implications are significant: a substantial portion of available Bitcoin will be held by participants with multi-year time horizons and minimal sensitivity to short-term price fluctuations. This reduces “float” available for purchase and can create supply squeezes during demand upswings.
The limitation here is straightforward: HODL waves are a lagging indicator. They confirm what already happened — strong hands accumulating — but don’t reliably predict future price action. The same metric was elevated during the 2021 bull market. Accumulation during price weakness is constructive; accumulation during strength is ambiguous.
Exchange Reserves and Supply Dynamics
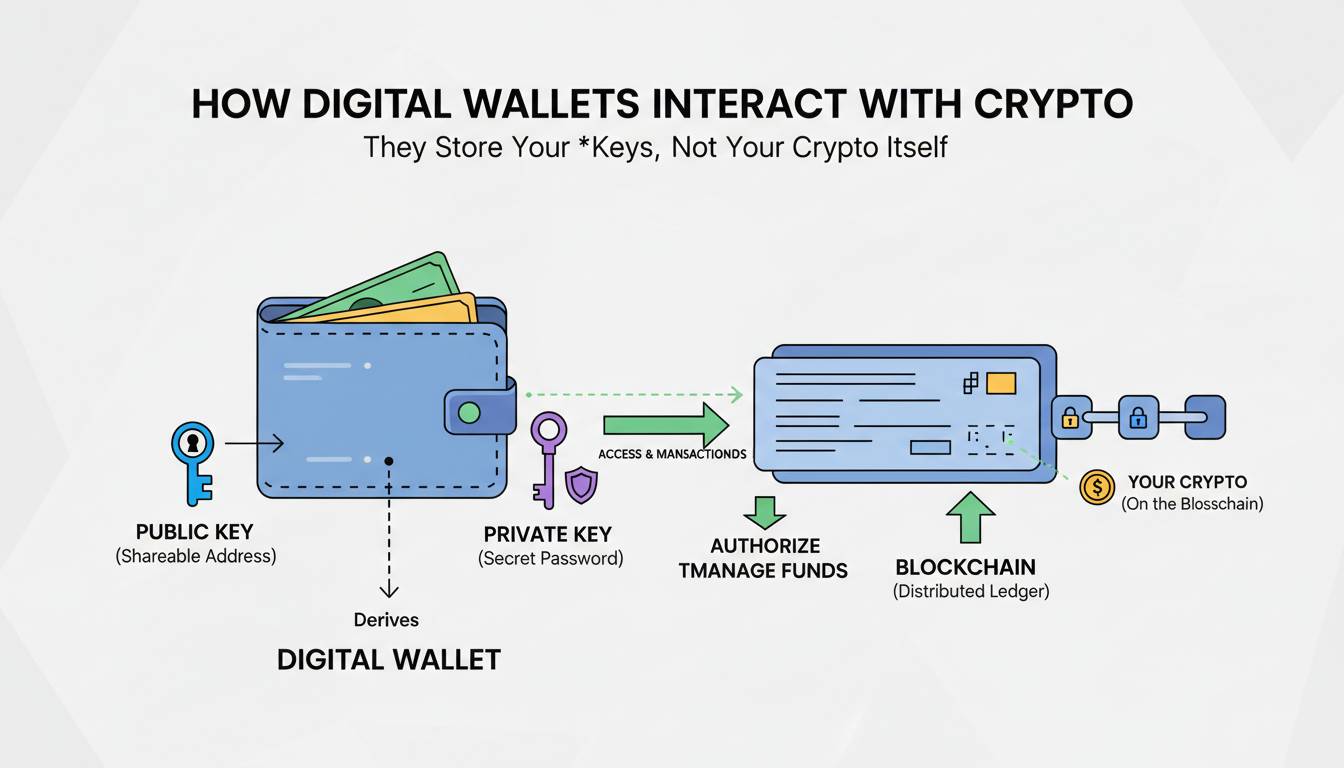
Exchange reserve data shows a consistent trend: Bitcoin held on exchanges has declined substantially from its 2020-2021 peaks. This reflects the maturation of self-custody practices, the growth of institutional custody solutions, and a general preference among holders to control their own keys.
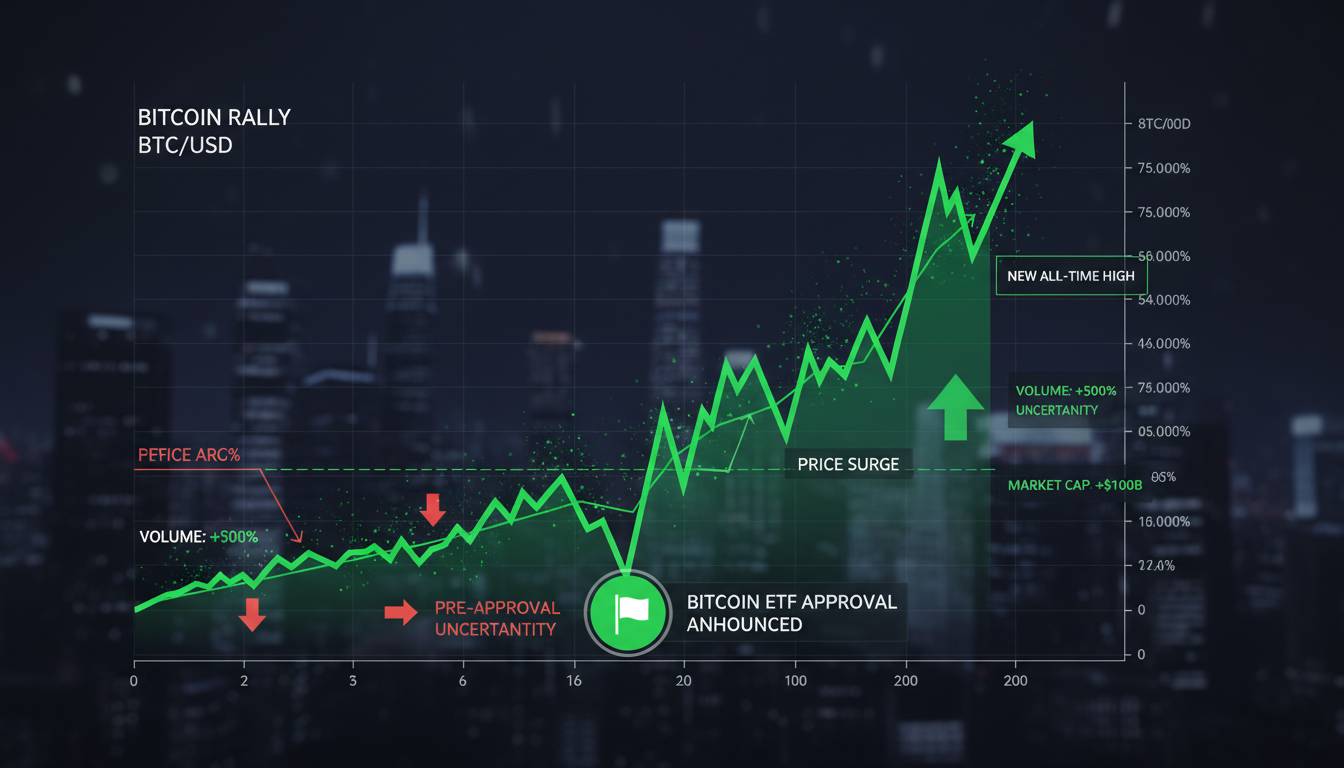
Lower exchange reserves typically precede or accompany price increases because they indicate holders moving Bitcoin away from “hot” wallets where it could be sold. When demand surges, the reduced inventory on exchanges can accelerate price moves. This dynamic played out during the 2020-2021 bull run and again during the 2024 ETF-driven rally.
The caveat: exchange reserve data has become somewhat less informative as the number of exchange addresses has grown and as institutional custody solutions have proliferated. What looks like “withdrawal” might simply be migration to custodians that don’t count as “exchanges” in traditional metrics. The signal is still meaningful but less pristine than in Bitcoin’s earlier history.
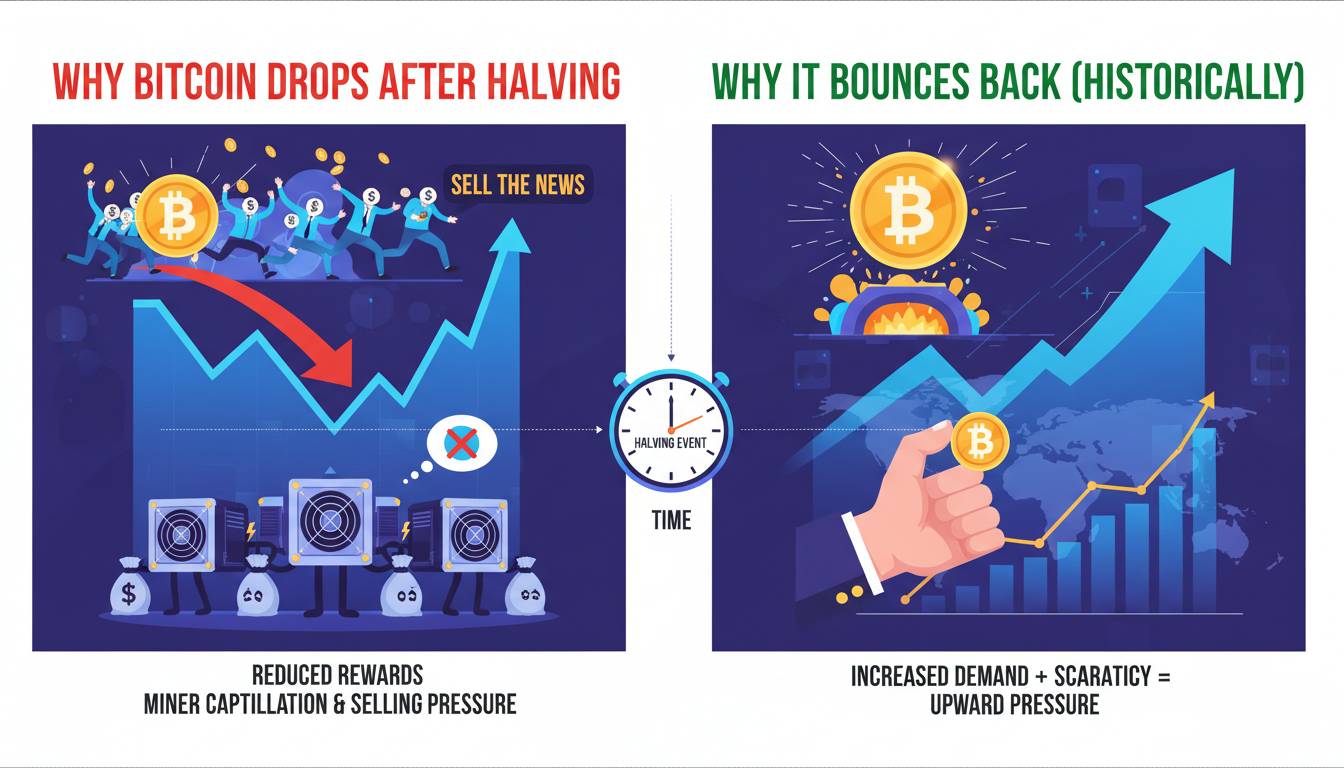
Miner Revenue and Network Health
Bitcoin’s mining ecosystem provides useful signals about network health and miner capitulation risk. The 2024 halving reduced block rewards from 6.25 BTC to 3.125 BTC, placing pressure on lower-efficiency miners. Historical patterns suggest that miner capitulation — forced selling by overleveraged or inefficient operations — often precedes or accompanies cycle lows.
By 2026, the mining industry will have fully absorbed the post-halving reward structure. Larger, more capital-efficient operations will likely consolidate market share. Hashrate will almost certainly continue its upward trajectory given technological advancement and economic incentive.
The on-chain takeaway: the mining ecosystem is more resilient than in previous cycles, but still subject to significant cost pressures. Energy costs remain the primary variable. Miners operating in jurisdictions with expensive electricity face ongoing stress if Bitcoin’s price doesn’t maintain sufficient levels to cover operational costs.
SOPR and Realized Cap
The Spent Output Profit Ratio (SOPR) measures whether Bitcoin is being sold at a profit or loss. Values above 1 indicate profitable spending; values below 1 indicate loss-taking. Historically, sustained SOPR readings below 1 have preceded cycle bottoms, while SOPR peaks have coincided with local tops.
Recent data shows SOPR maintaining elevated levels during price rallies, suggesting that long-term holders are distributing into strength rather than accumulating. This is typical mid-cycle behavior. The metric to watch is SOPR during price corrections — does selling occur at profit (healthy) or loss (potentially concerning)?
Realized cap — the aggregate cost basis of all Bitcoin — provides a floor valuation for the network. As realized cap rises, the effective cost basis of the entire holder base increases, creating psychological and economic support levels. By 2026, realized cap will almost certainly be substantially higher than 2024 levels, providing a structurally higher floor regardless of price action.
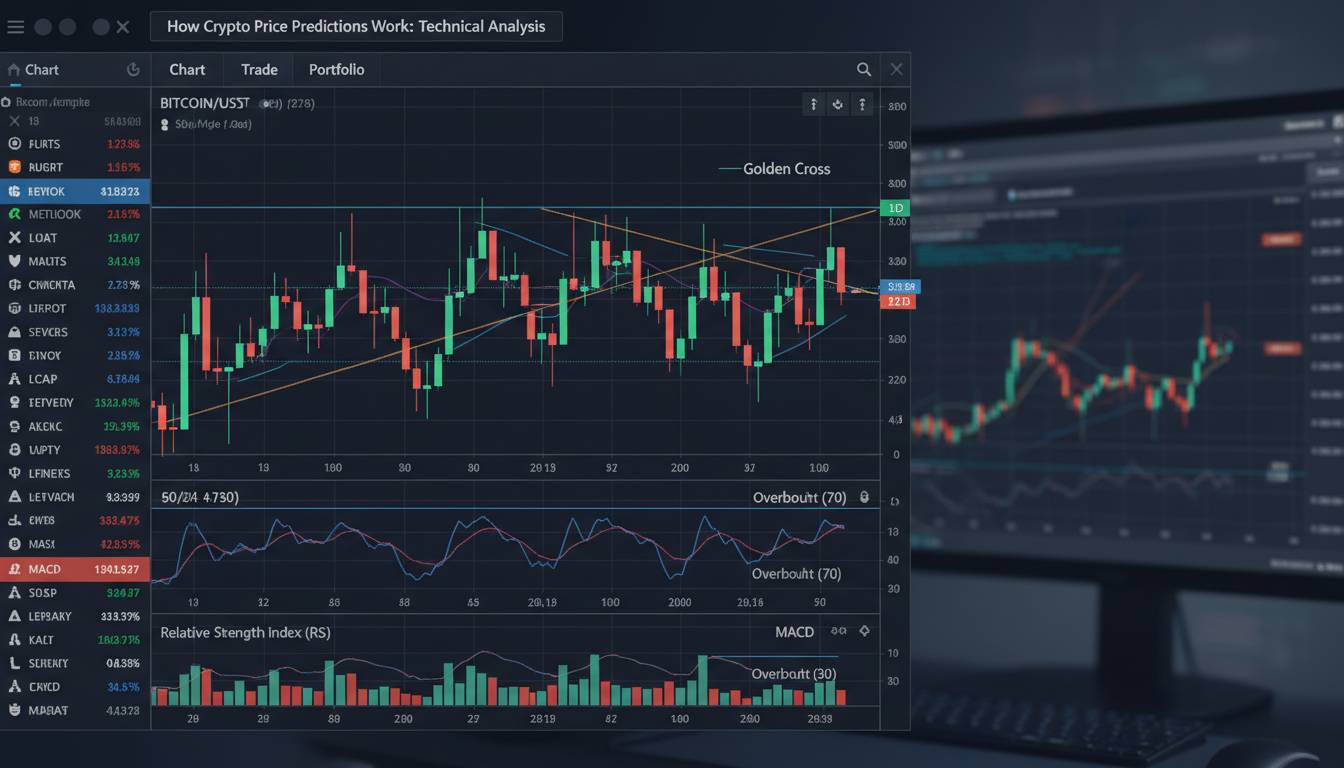
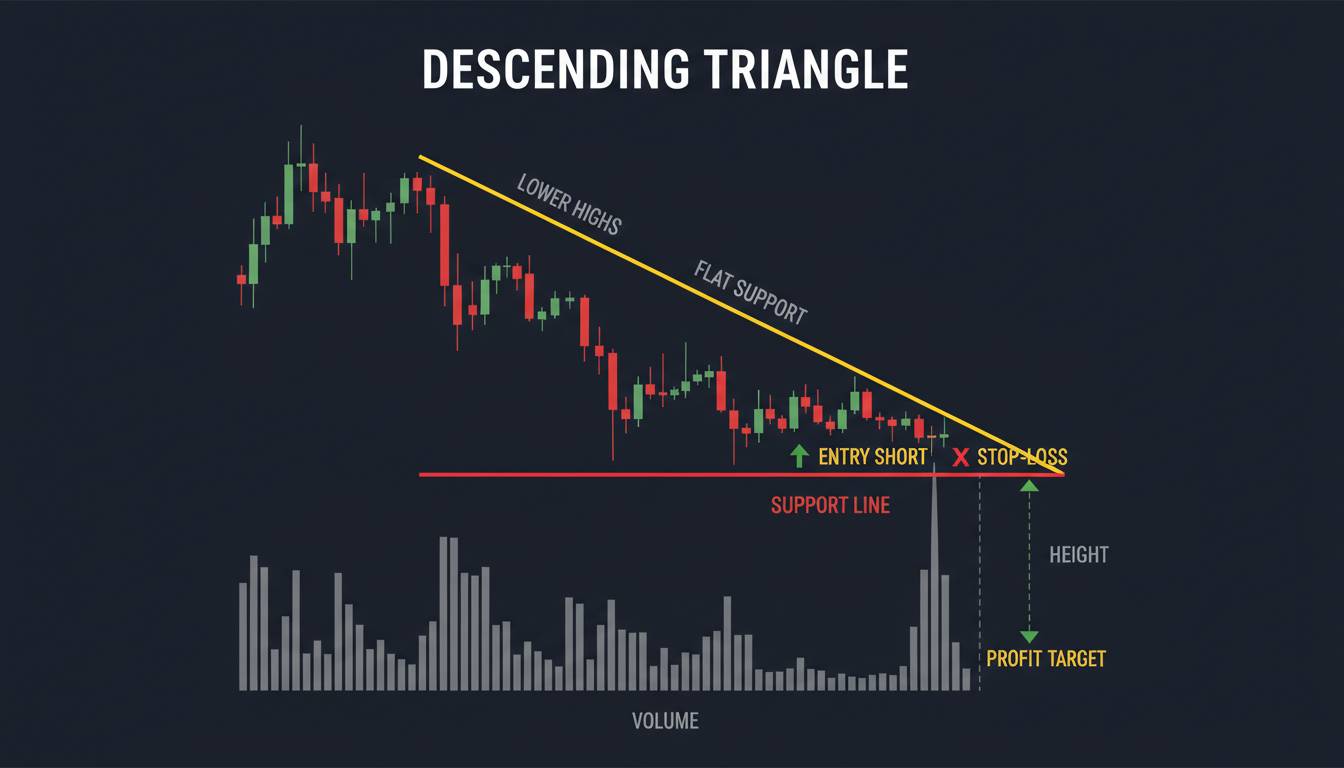
Technical Analysis: Cycles, Patterns, and Price Levels
Technical analysis applied to Bitcoin requires adaptation. The cryptocurrency’s unique characteristics — fixed supply, growing adoption, and extreme volatility — mean that traditional chart patterns require modification.
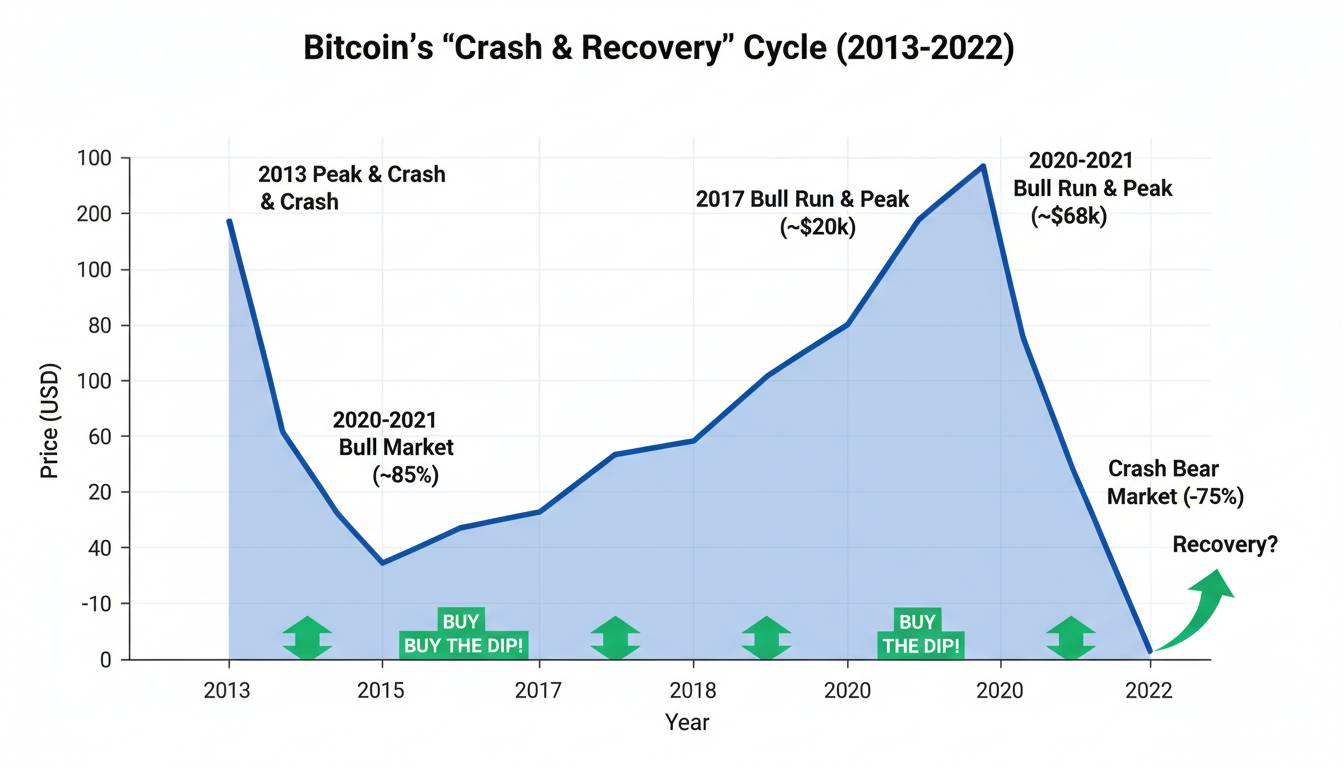
Historical Cycle Analysis
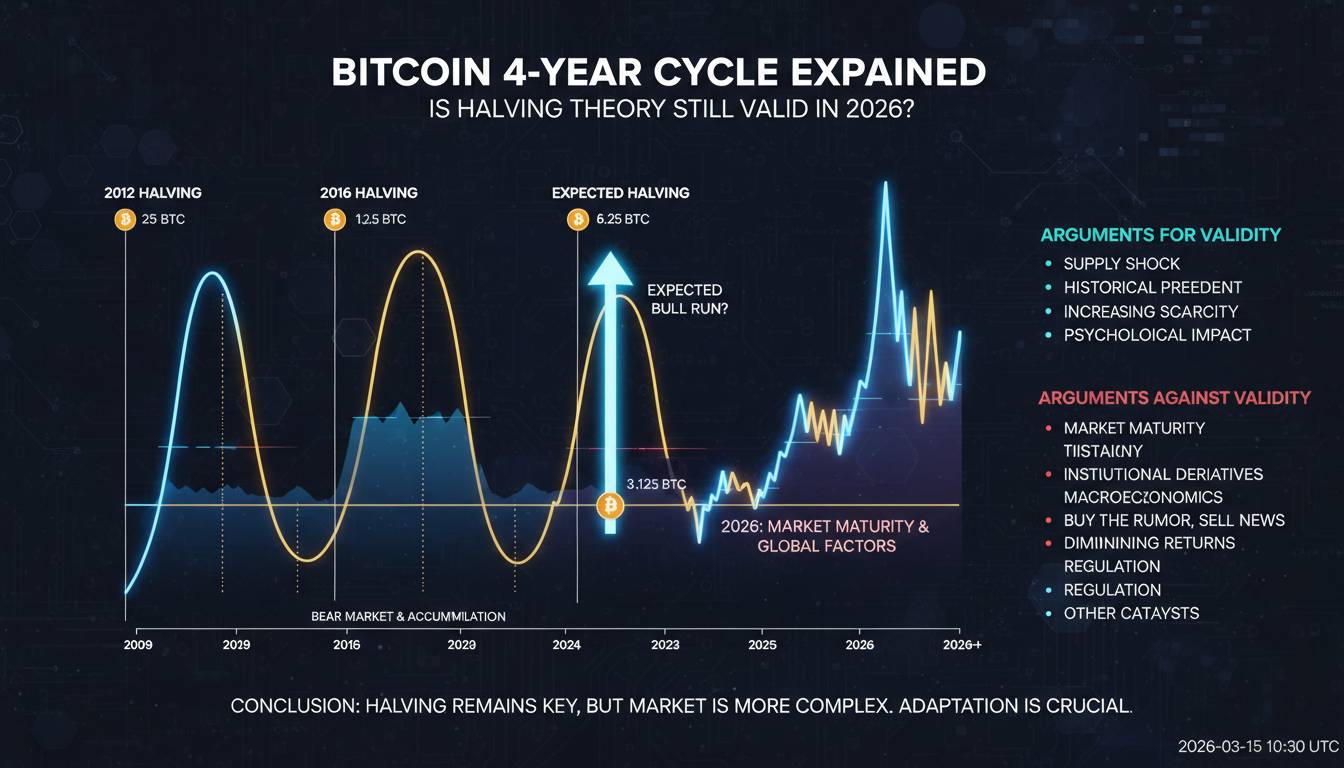
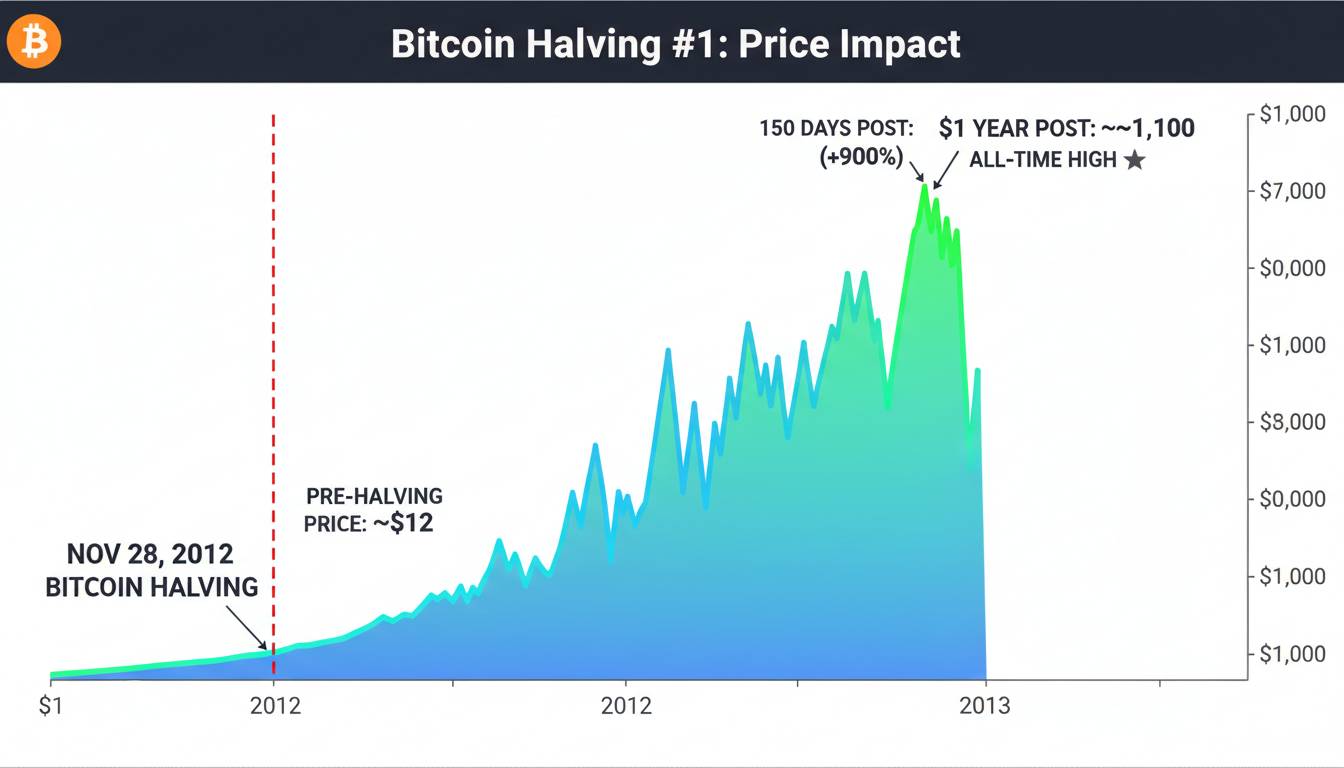
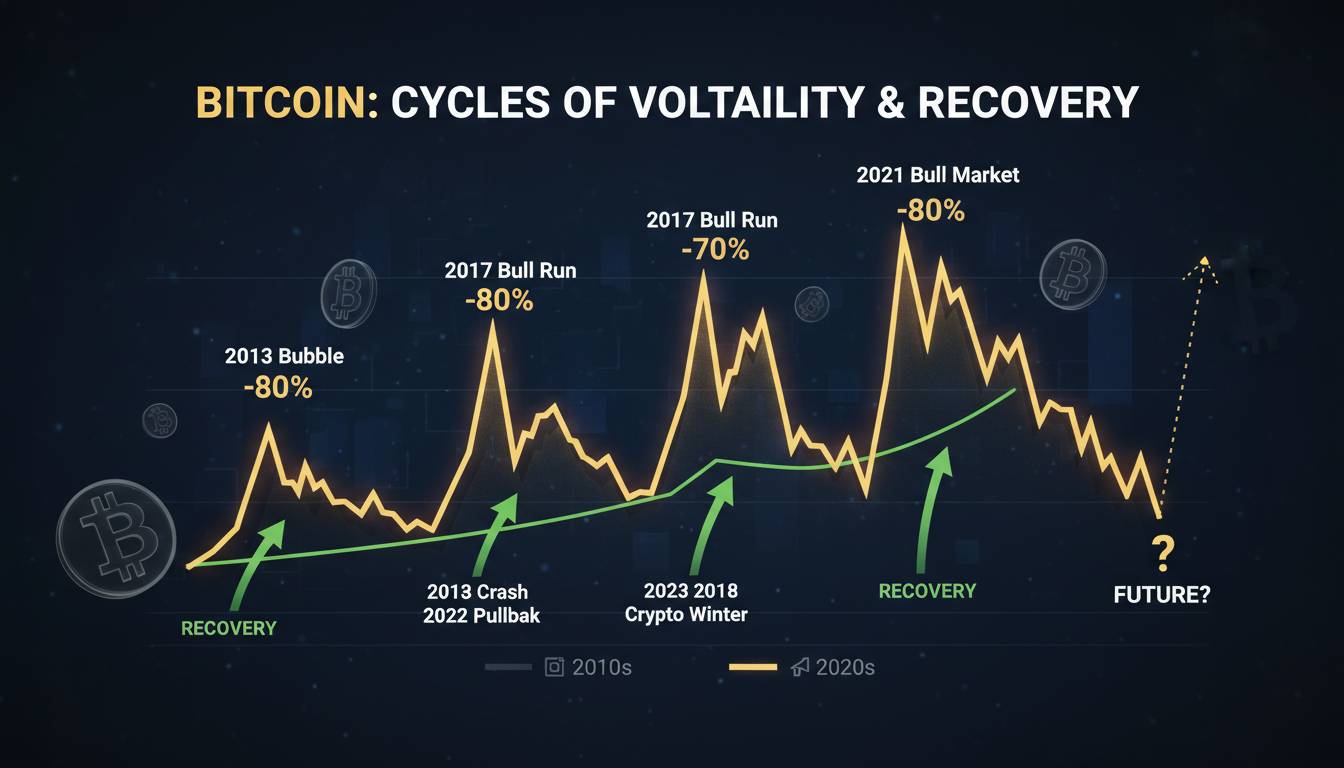
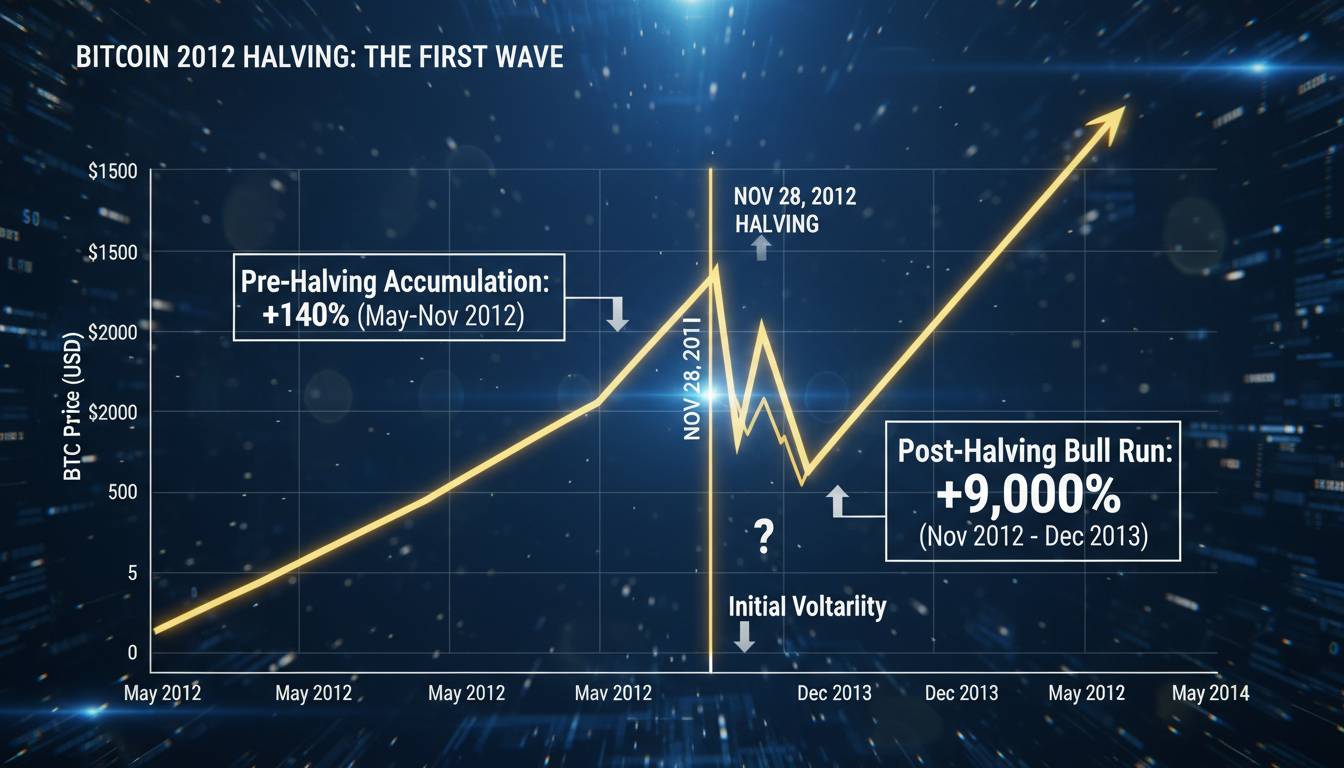
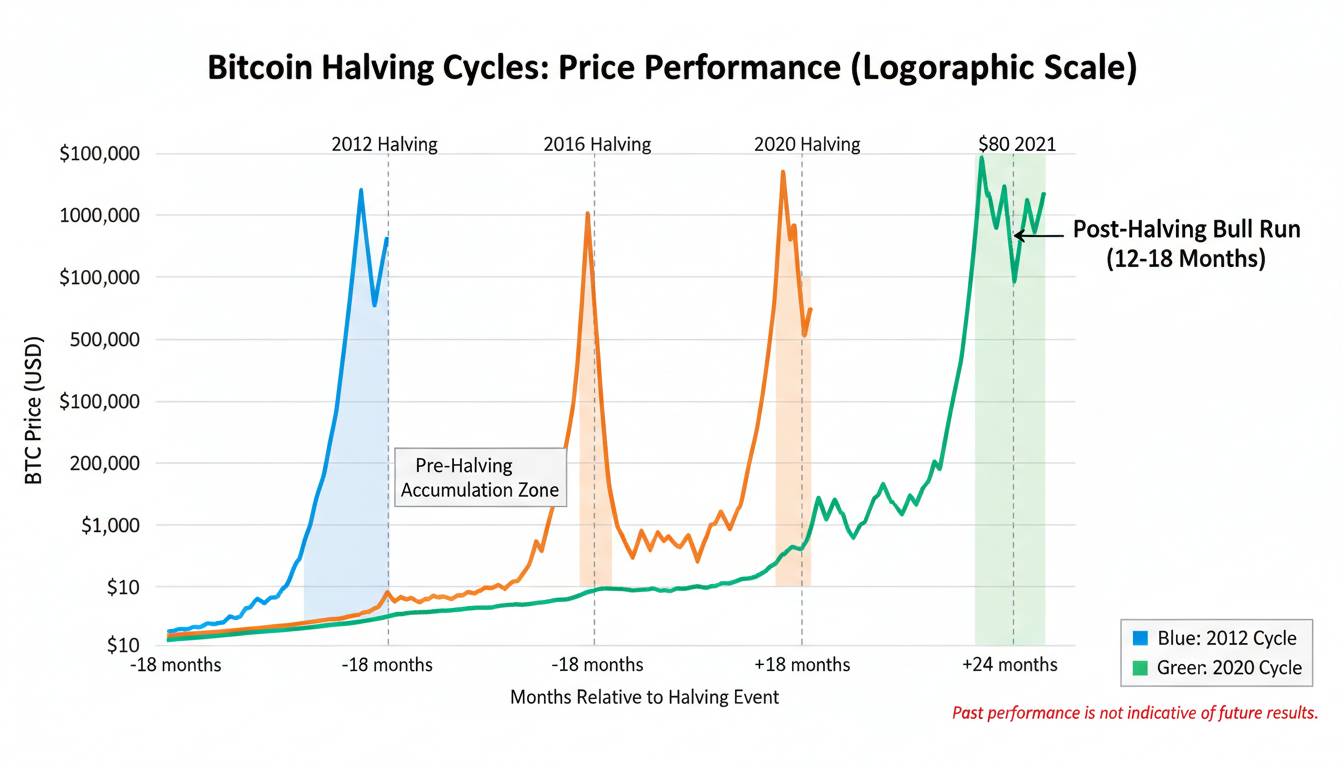
Bitcoin’s four-year halving cycle remains the dominant framework for macro technical analysis. Each cycle — 2012, 2016, 2020 — has followed a recognizable pattern: pre-halving accumulation, post-halving rally, mania phase, and subsequent correction. The 2024 halving fits this template.
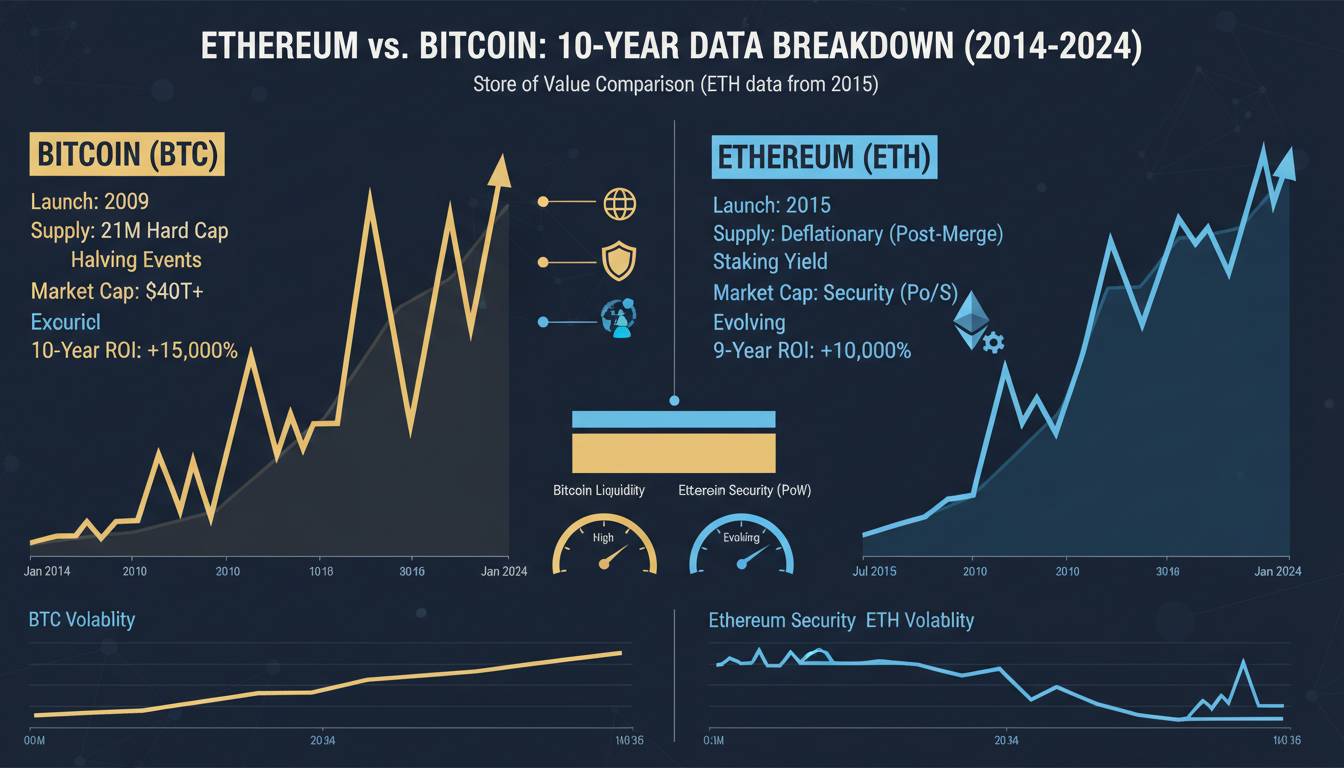
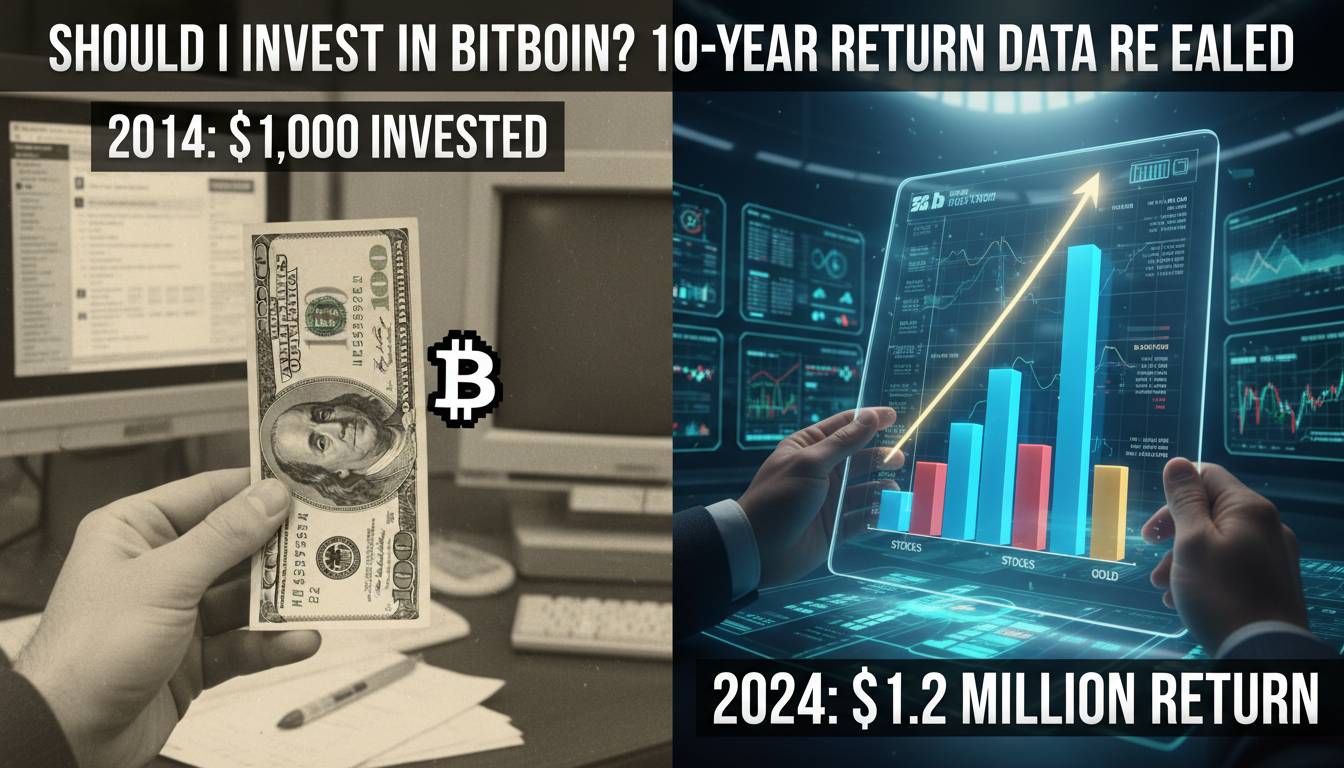
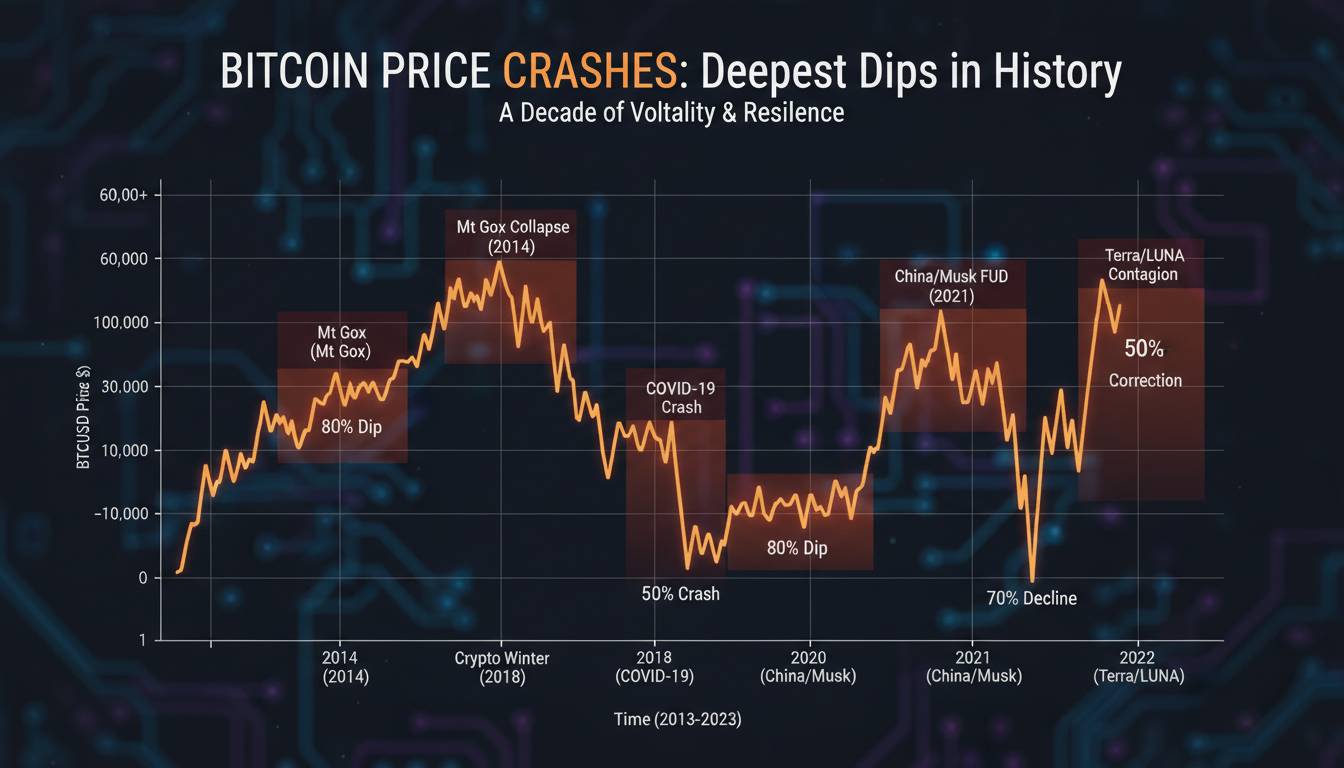
The complication is that each cycle has produced different percentage returns. The 2013 cycle saw approximately 5,000% gains from cycle low to peak. The 2017 cycle delivered roughly 1,300%. The 2021 cycle managed approximately 1,100%. The pattern suggests diminishing returns as market capitalization grows — a mathematical inevitability given the fixed supply.
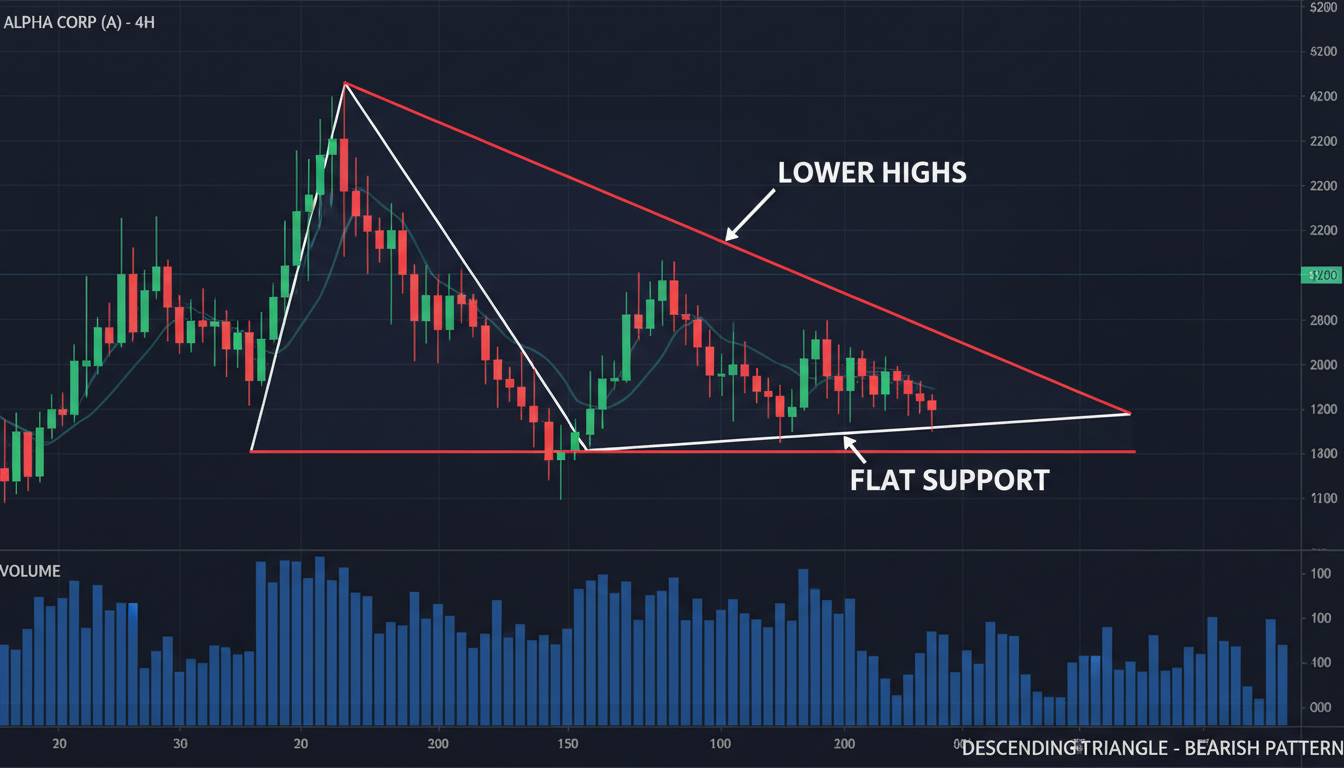
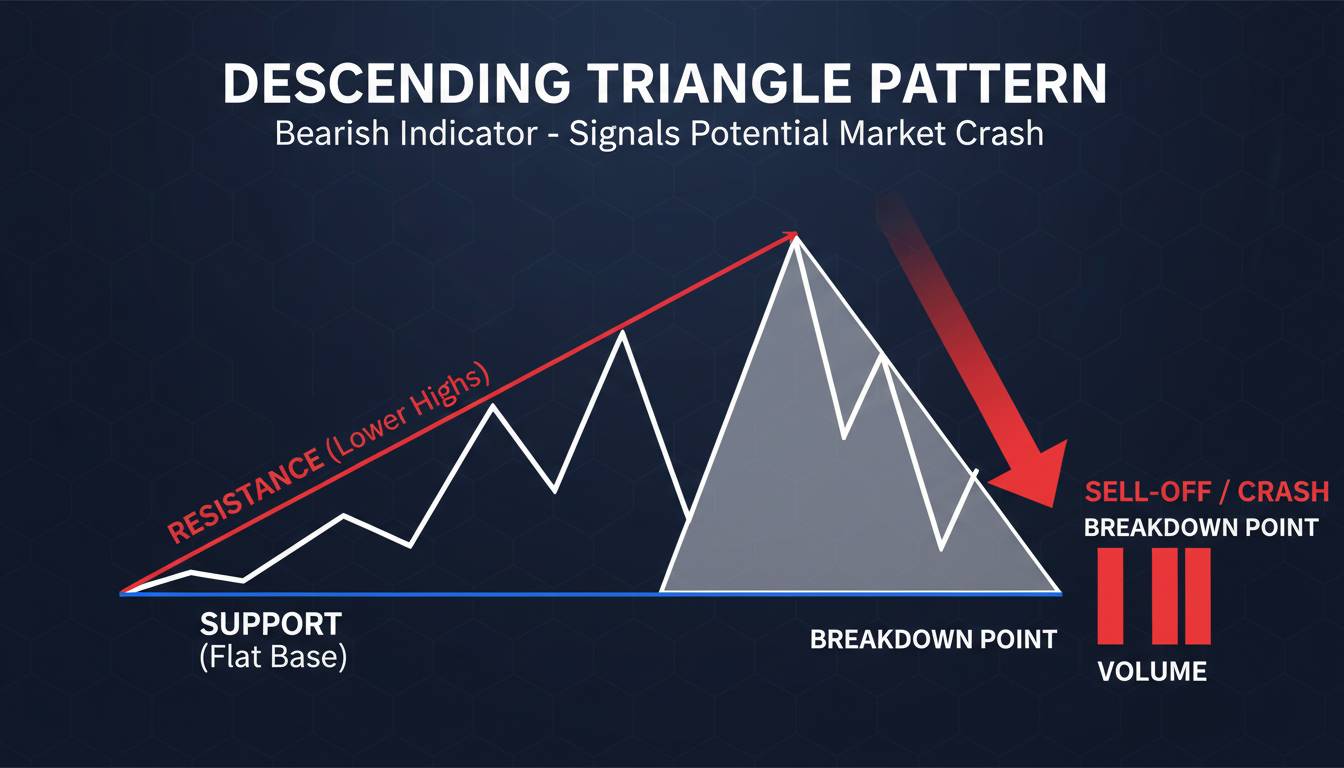
For 2026, the question is whether we’re in the early, middle, or late phase of the current cycle. If history repeats, 2025 would likely contain the cycle peak, with 2026 representing either continuation at lower highs or the beginning of the correction phase. This doesn’t mean Bitcoin can’t reach new highs in 2026 — it likely will — but the asymmetric return profile that characterized earlier cycles probably won’t repeat.
The counterargument: the ETF-driven institutional demand represents a structural break from prior cycles. Rather than applying historical cycle templates mechanically, the safer assumption is that cycle top timing becomes less predictable while cycle amplitude becomes more constrained.
Moving Average Analysis
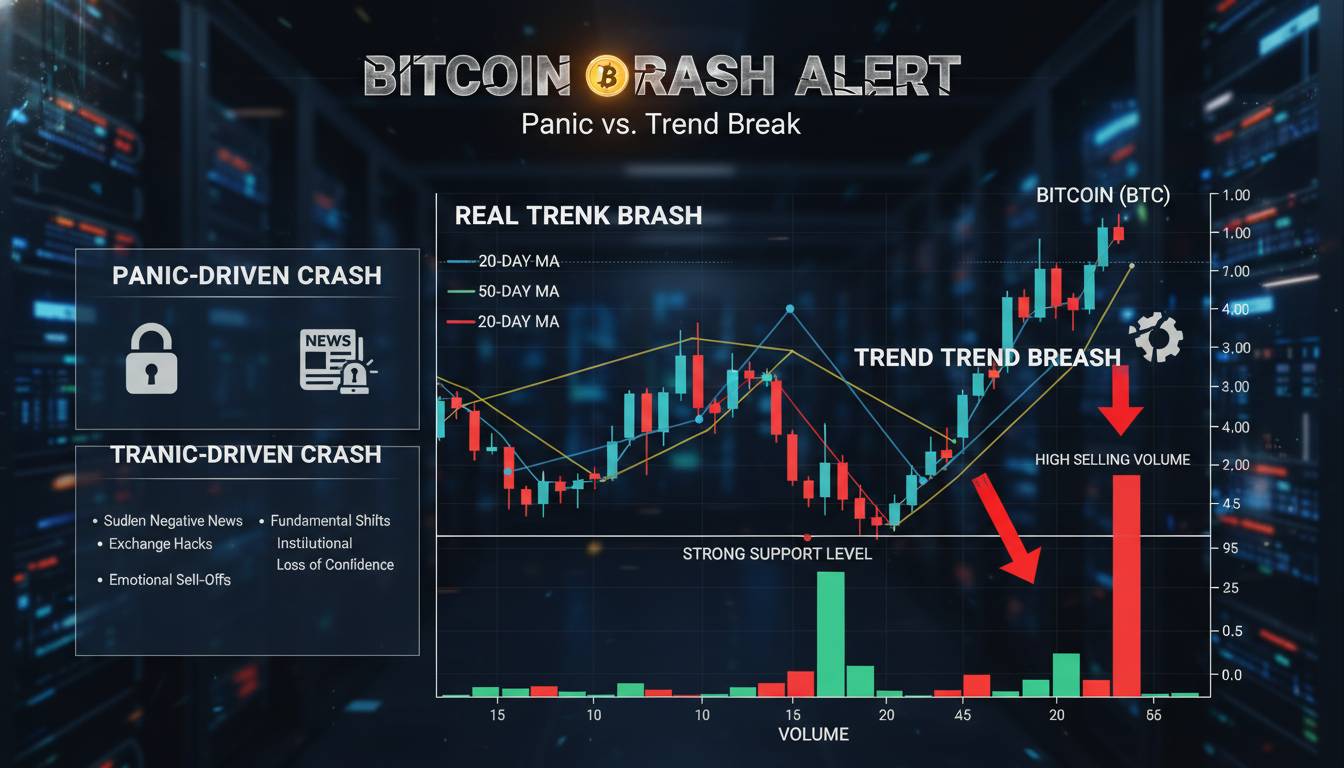
The 200-week moving average has historically served as a reliable long-term support level. During the 2022 correction, Bitcoin’s low approximately matched the 200-week MA — a pattern consistent with prior cycles. Similarly, the 200-day moving average often marks the boundary between bull and bear market regimes.
By early 2025, Bitcoin had traded substantially above both these averages, indicating a technically healthy trend. The relevant question for 2026 is whether price maintains these levels during any correction, or whether a more significant breakdown occurs.
The 50-week and 100-week moving averages provide intermediate signals. Golden crosses — when the 50-week crosses above the 100-week — have historically preceded or accompanied bullish phases. Death crosses have signaled bearish transitions, though in Bitcoin’s history these have often marked cycle lows rather than the beginning of extended bear markets.
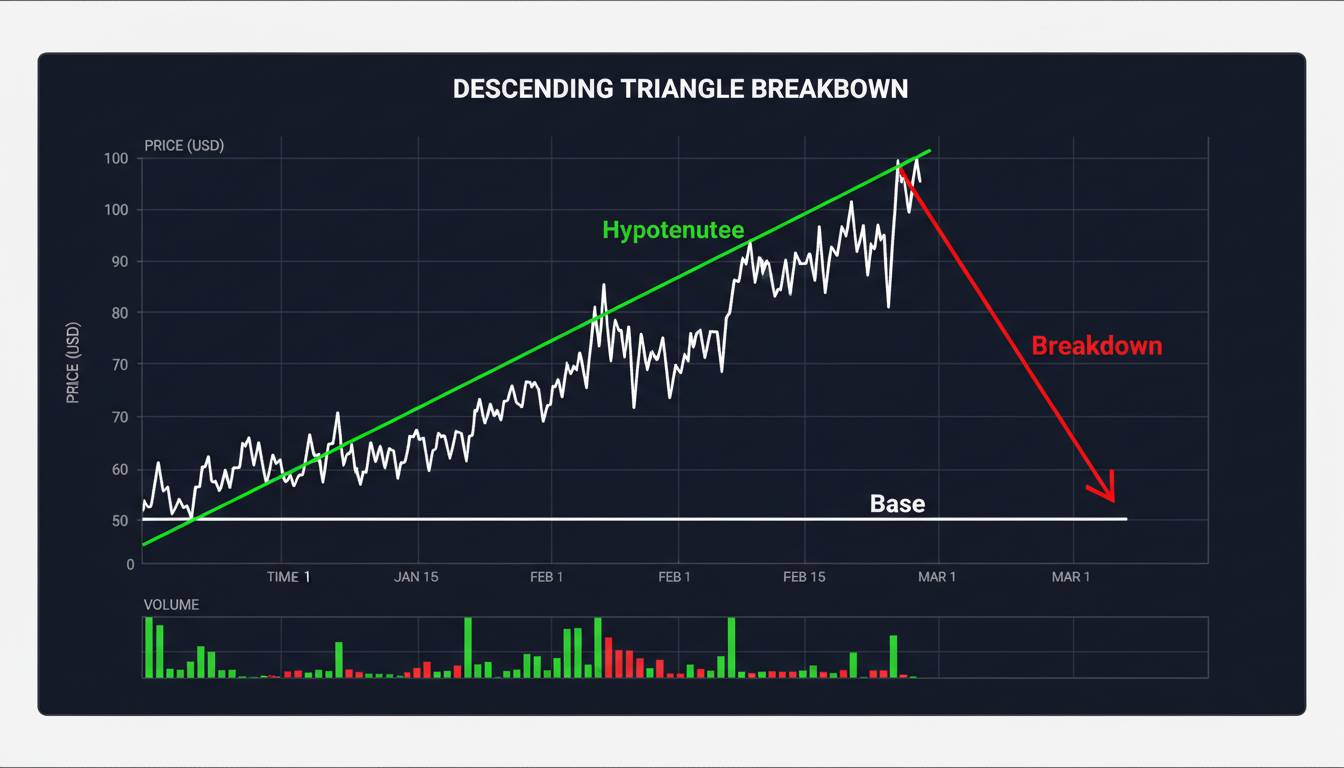
Support and Resistance Levels
Key technical levels for 2026 include:
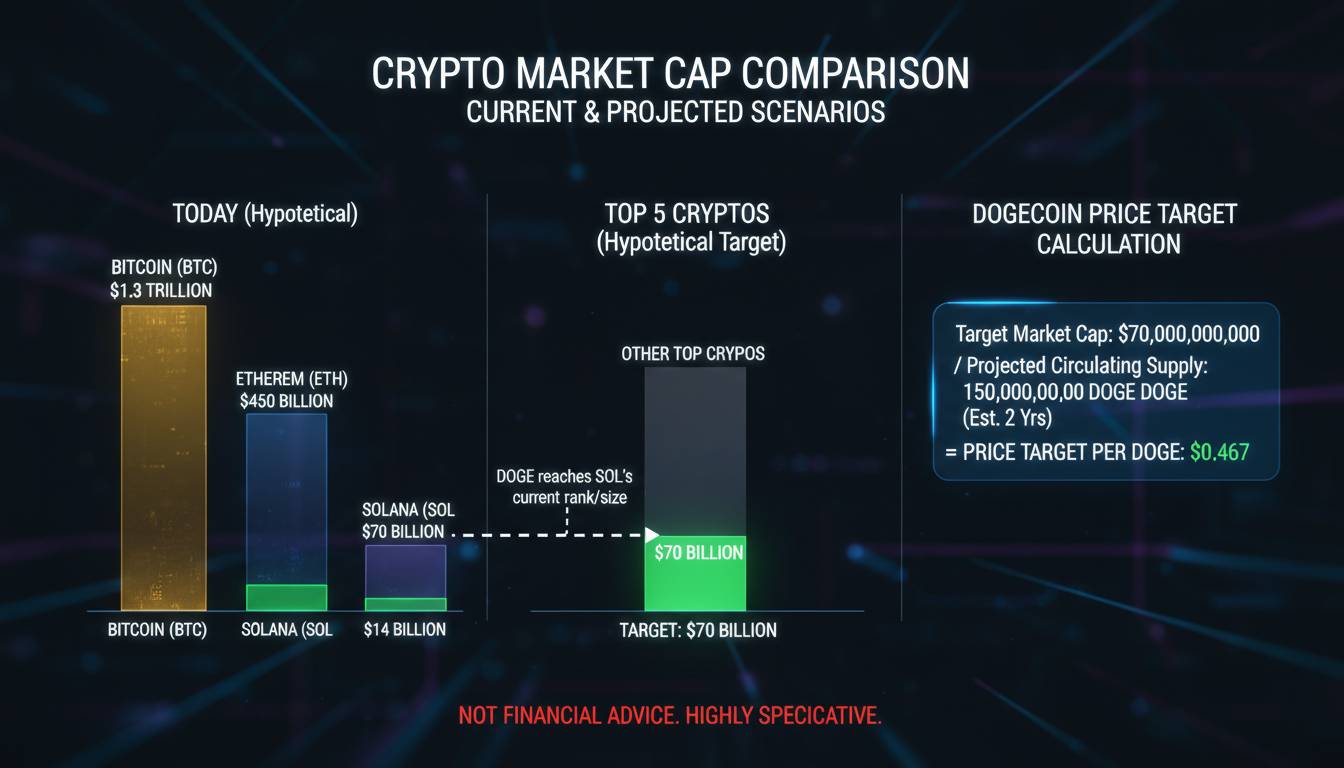
- Previous cycle highs: The 2021 peak around $69,000 represents major psychological and technical resistance. Breaking above this level decisively would open upside potential toward six-figure prices.
- Round numbers: $100,000 remains a significant psychological barrier that often functions as self-fulfilling resistance or support depending on the approach.
- Historical reject levels: Prices where Bitcoin has previously failed often become support if revisited. The $60,000-$65,000 range tested multiple times in 2024 would represent significant support if maintained into 2026.
The honest assessment: technical levels are useful for risk management and context but don’t determine price. They reflect collective trader behavior, which itself responds to news, macro conditions, and shifting narratives.
Synthesized Scenarios: Where the Data Converges and Diverges
Rather than offering a single price prediction — an exercise that rewards confidence over accuracy — it’s more useful to outline scenarios with their respective probabilities and drivers.
Bull Case: $150,000 – $250,000
The optimistic scenario requires multiple factors aligning: continued or accelerated ETF inflows, a supportive macro environment with declining rates, and perhaps a sovereign wealth fund allocation or other black-swan demand event. Technically, breaking decisively above $100,000 with strong volume would suggest further upside.
Under this scenario, the on-chain data would show continued accumulation among long-term holders, declining exchange reserves, and SOPR remaining elevated but not reaching mania levels. The risk is that extreme bullishness typically precedes corrections.
Base Case: $80,000 – $120,000
The most probable outcome given current data involves continued institutionalization, moderate macro tailwinds, and some correction from cycle highs. This scenario assumes ETF flows remain positive but decelerate, no major black-swan events occur in either direction, and the broader risk-asset environment remains constructive.
Technically, this would likely involve 2025 containing the cycle peak near $100,000-$130,000, with 2026 trading in a lower range as the market digests gains. On-chain metrics would show some distribution but no capitulation event.
Bear Case: $35,000 – $55,000
The pessimistic scenario requires a significant macro shock — recession, inflation resurgence, or geopolitical crisis — combined with regulatory headwinds or a loss of narrative support. Technically, breaking below the 200-week moving average decisively would signal this regime.
On-chain, this would manifest through exchange reserve accumulation (holders moving Bitcoin to exchanges for sale), SOPR declining below 1 for extended periods, and increasing miner stress. The question is whether such a decline would represent a cycle low or a more extended bear market — historical precedent suggests the former.
Risk Factors and Unresolved Questions
Several factors could disrupt any of these scenarios. Regulatory risk remains substantial: a significant regulatory crackdown in a major market like the United States or the European Union would meaningfully impact liquidity and institutional appetite. The exact form such regulation might take remains uncertain, making it difficult to price into scenarios.
The competition from central bank digital currencies (CBDCs) represents a longer-term concern that could affect Bitcoin’s narrative and utility, though CBDC development remains uneven across jurisdictions. Some analysts argue CBDCs actually validate the underlying Bitcoin thesis; others worry about state-sponsored alternatives capturing digital payment preference.
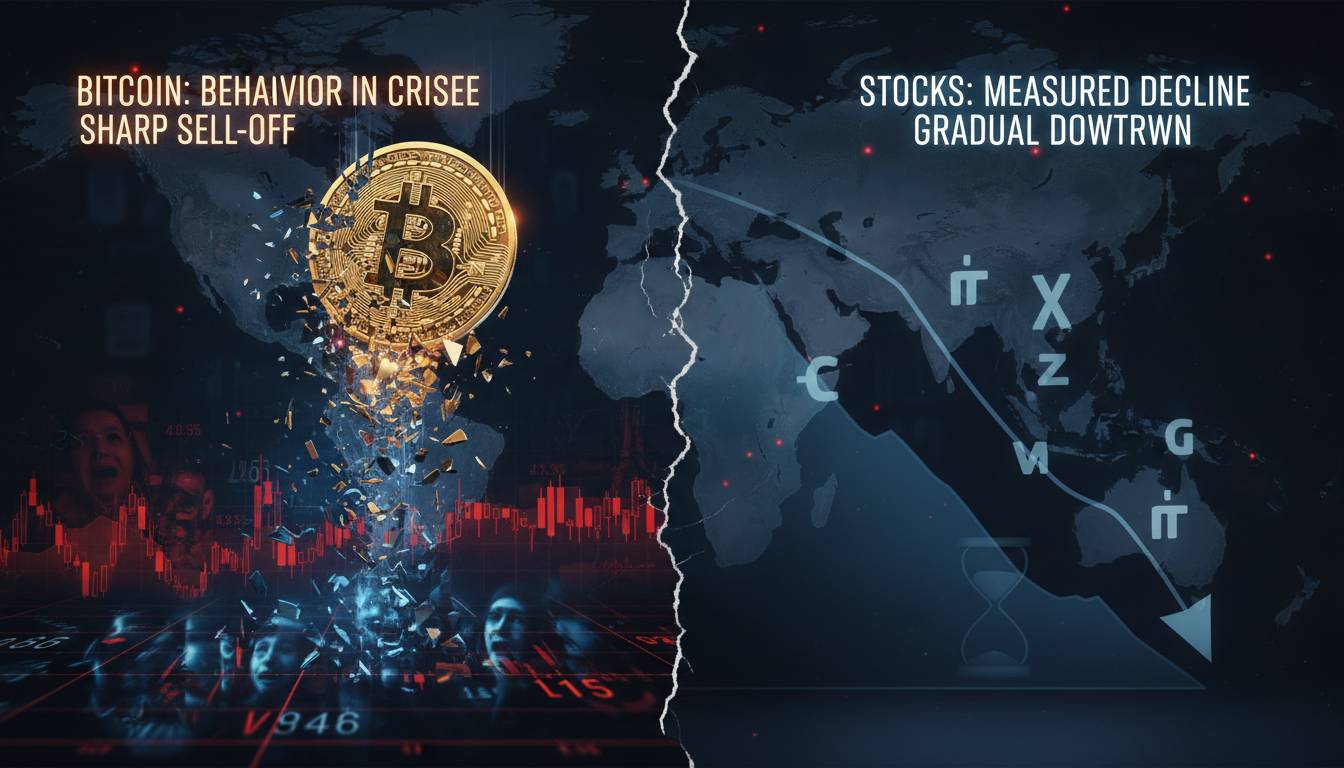
Macroeconomic black swans — the events that aren’t in the baseline forecast — deserve particular attention. The 2020 COVID crash demonstrated how quickly risk assets can decline in a crisis, even when central bank intervention ultimately supported recovery. 2026 might bring entirely unexpected developments that reshape the investment landscape.
One honest admission: the framework I’ve outlined treats each analytical pillar somewhat separately, but in reality these factors interact in complex, non-linear ways. A positive shock in one area can offset negative developments in another. The models that perform best acknowledge this complexity rather than pretending to certainty the data doesn’t provide.
Conclusion: What Each Data Type Actually Suggests
The macro framework suggests structural support from institutional adoption but sensitivity to monetary policy and risk-asset sentiment. The on-chain data indicates a healthier holder base than in previous cycles, with reduced exchange float and continued accumulation, though these are lagging indicators. The technical picture shows Bitcoin in a long-term uptrend but approaching levels where historical cycles have produced significant corrections.
The synthesis is neither particularly bullish nor bearish. Bitcoin is more institutionalized, more technically mature, and more integrated into the broader financial system than ever before. These factors suggest higher floors than previous cycles but also potentially lower ceilings for percentage returns. The asset class is growing up, and its behavior reflects that maturation.
What remains genuinely unresolved is whether the next two years follow the established cycle template or whether the ETF-driven structural changes alter the pattern in ways that make historical comparison less useful. The data provides context and probability, not prediction. The question each investor must answer independently is what allocation makes sense given their risk tolerance and time horizon — not what the data definitively promises.
The only certainty is that Bitcoin will continue to surprise. The question is whether that surprise comes in the form of new highs, unexpected corrections, or events that no one currently anticipates. The data suggests caution against extreme positioning in either direction, and patience as the situation develops.