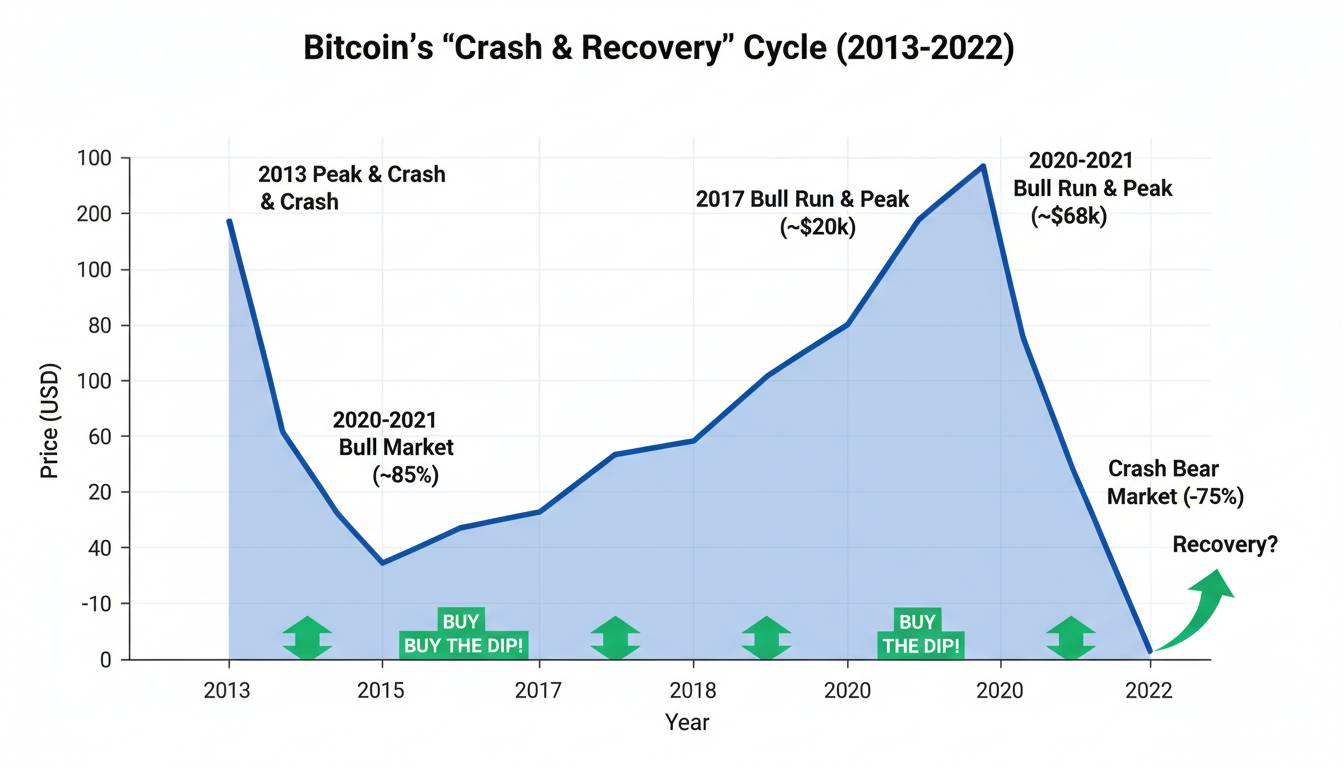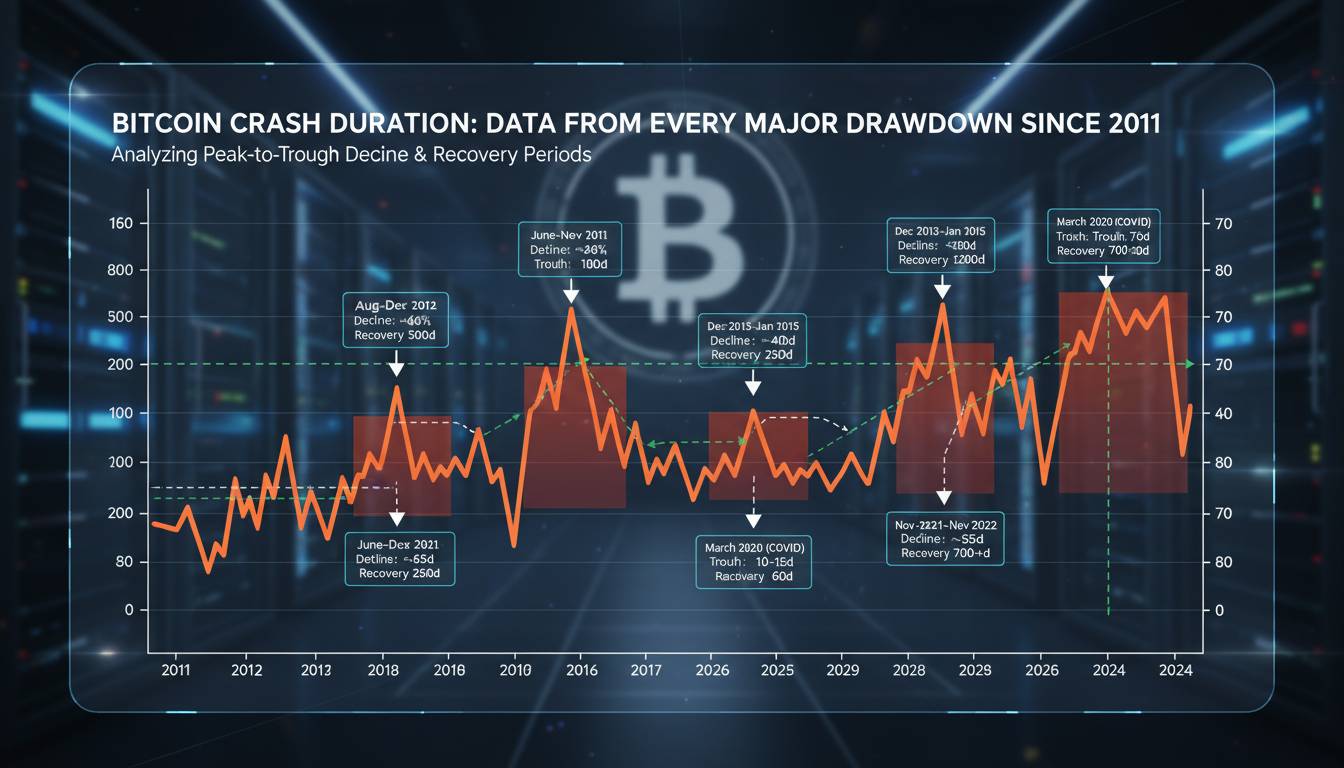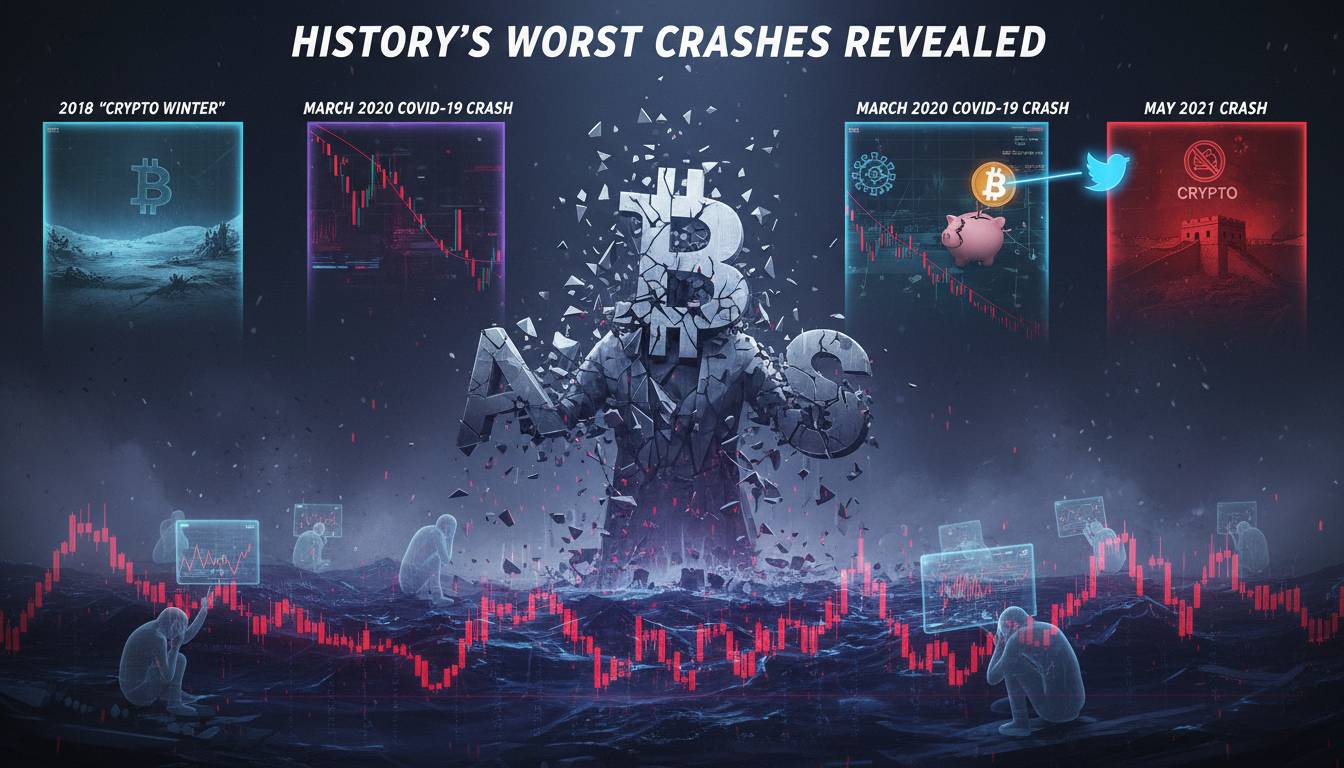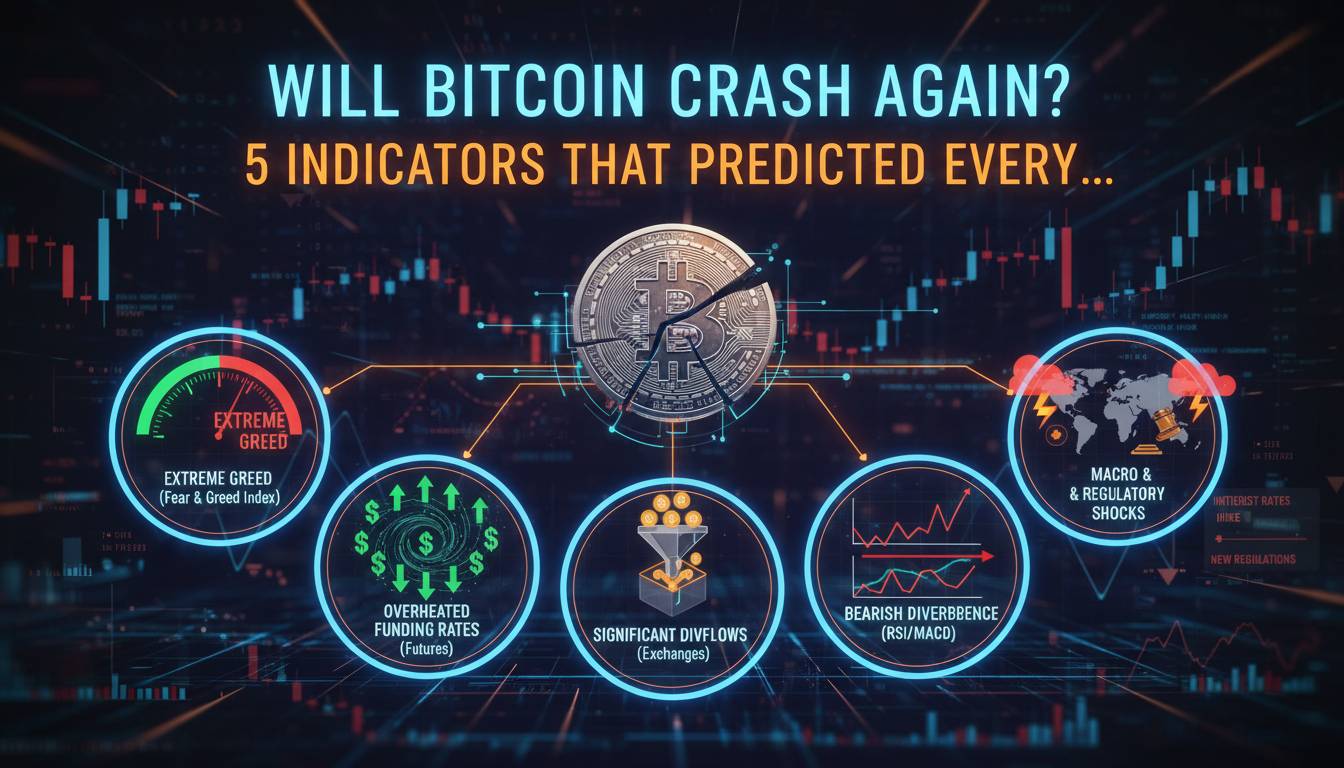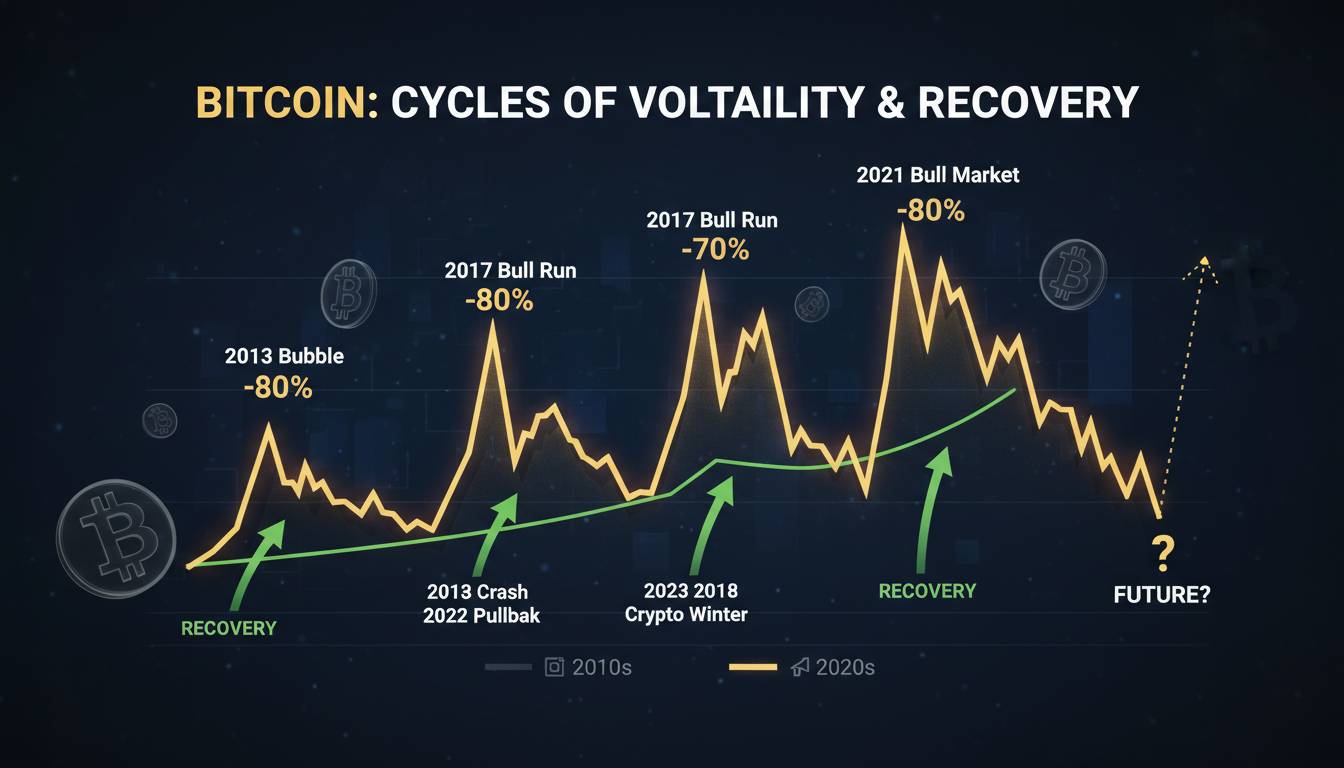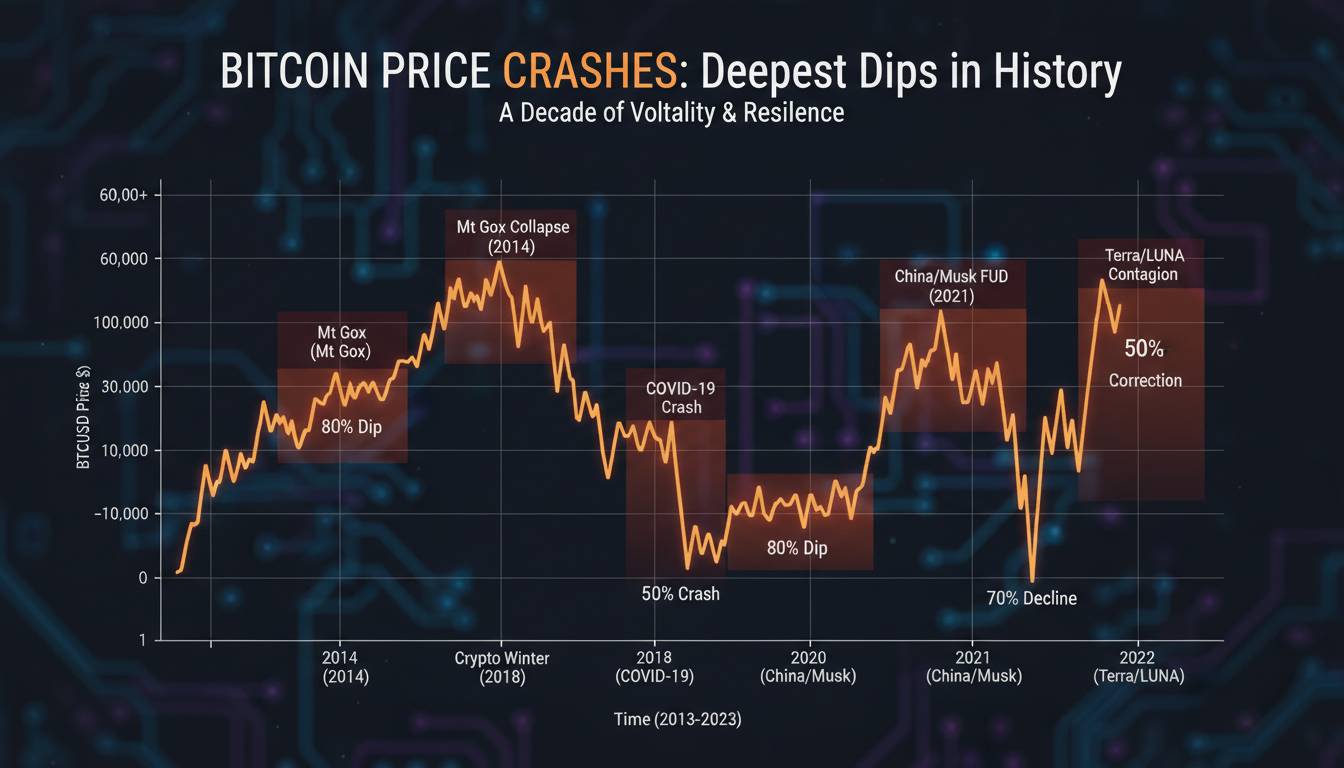
The crypto market remembers pain. Every major Bitcoin crash leaves liquidated positions, shattered portfolios, and the same refrain: “I didn’t see it coming.” The warning signs are usually visible — you just need to know where to look and the discipline to pay attention when everything feels bullish. I’ve been tracking these patterns since 2017. No indicator is perfect, but six signals consistently appear before most major corrections. Understanding them won’t make you invincible, but it’ll give you a fighting chance when the tide turns.
1. Perpetual Funding Rates Go Vertical
When funding rates on Bitcoin perpetual futures stay significantly positive for extended periods, the market has become dangerously one-sided. Funding rates are the periodic payments between long and short position holders — positive rates mean longs pay shorts, indicating most traders are bullish and willing to pay for that privilege.
In December 2021, funding rates stayed extraordinarily elevated for weeks as Bitcoin approached its all-time high near $69,000. The aggregate funding rate across major exchanges hovered around 0.10% to 0.15% daily — annualized, that’s roughly 35% to 55% that long positions were paying to short positions just to maintain their bets. This was not sustainable. Within weeks, the market began its brutal correction that would take Bitcoin below $20,000 by the following year.
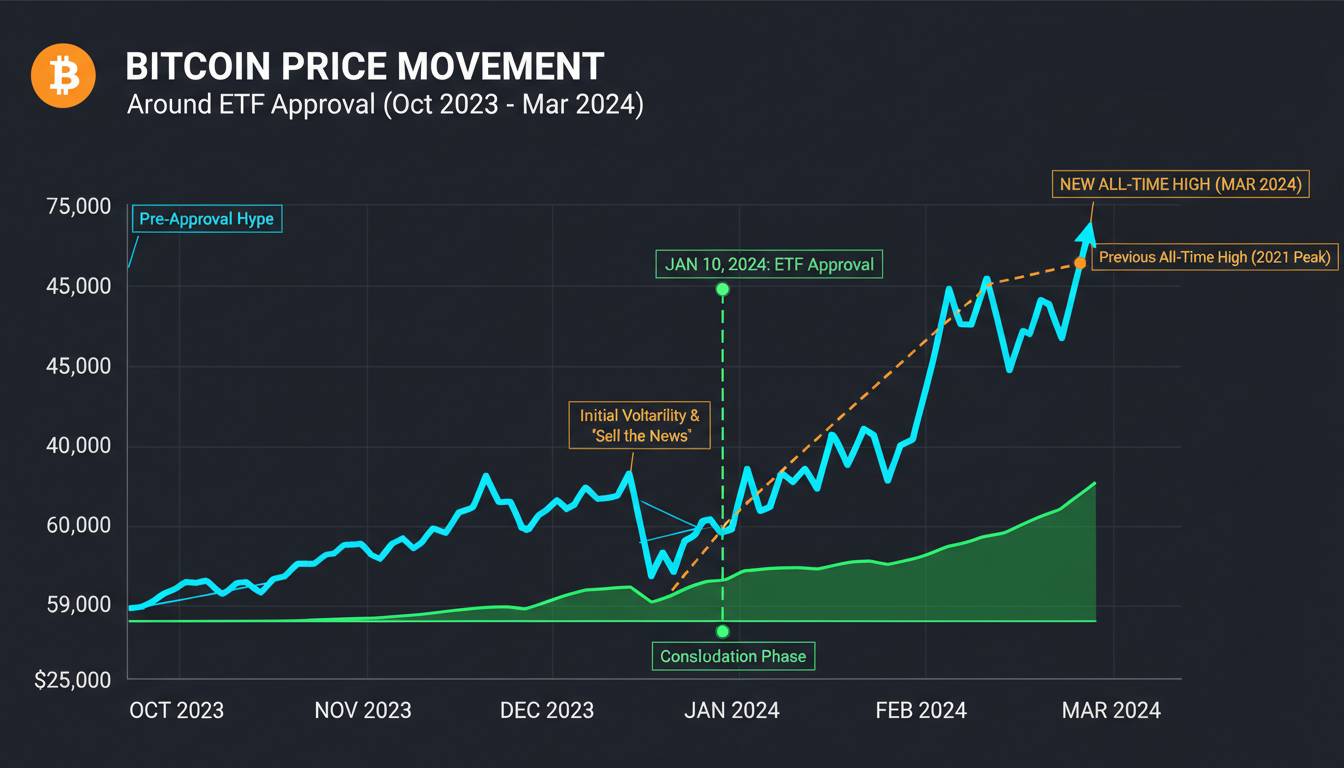
The same pattern emerged in March 2024, when Bitcoin surged past $73,000. Funding rates spiked to levels not seen since late 2021, and several perpetual markets showed negative funding — a sign of aggressive short squeeze potential that often precedes volatility in both directions. The subsequent drawdown was modest compared to prior cycles, but the principle held: extreme funding rates warn that leverage has become lopsided.
Track aggregate funding rates across Binance, Bybit, and other major venues through platforms like Coinglass or Glassnode. When funding rates stay above 0.10% daily for more than a week, tighten your stop losses and reduce position sizing. The market is telling you too many people are on the same side of the boat.
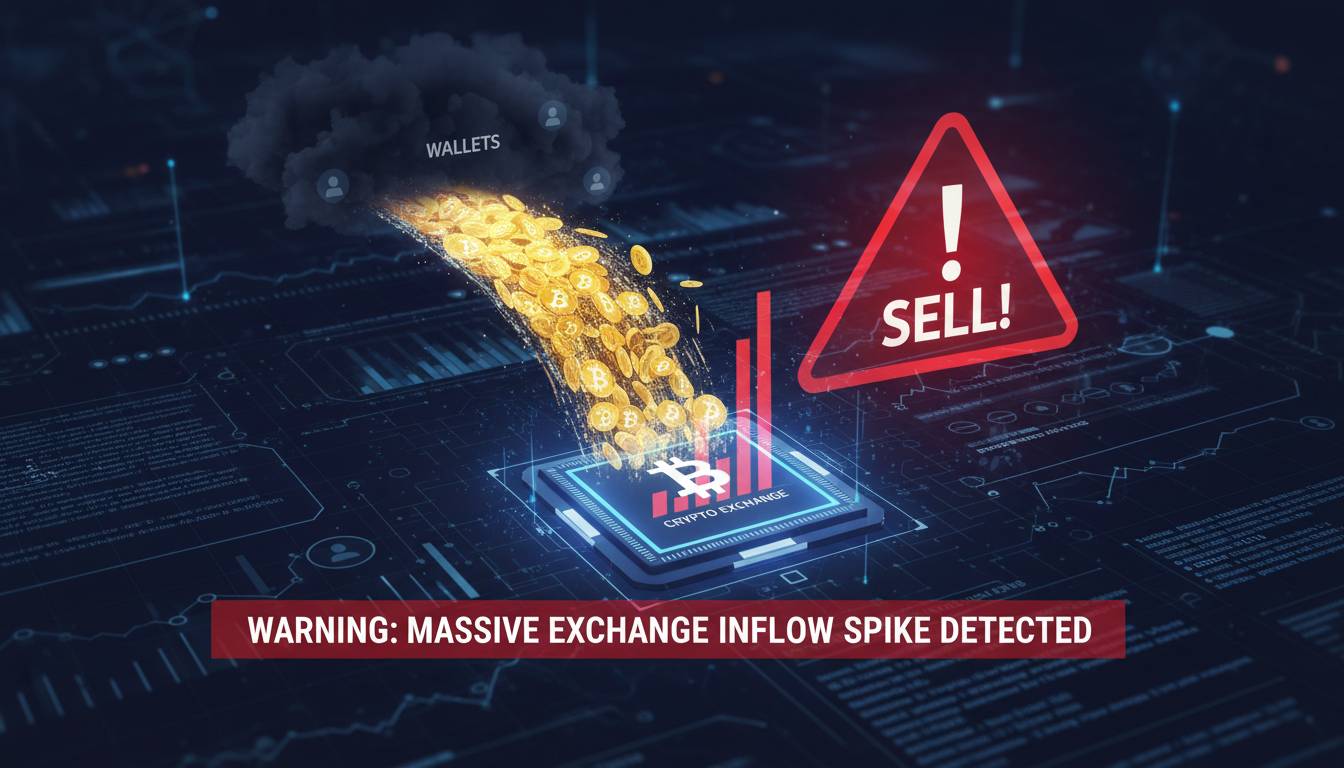
2. Exchange Inflow Spike
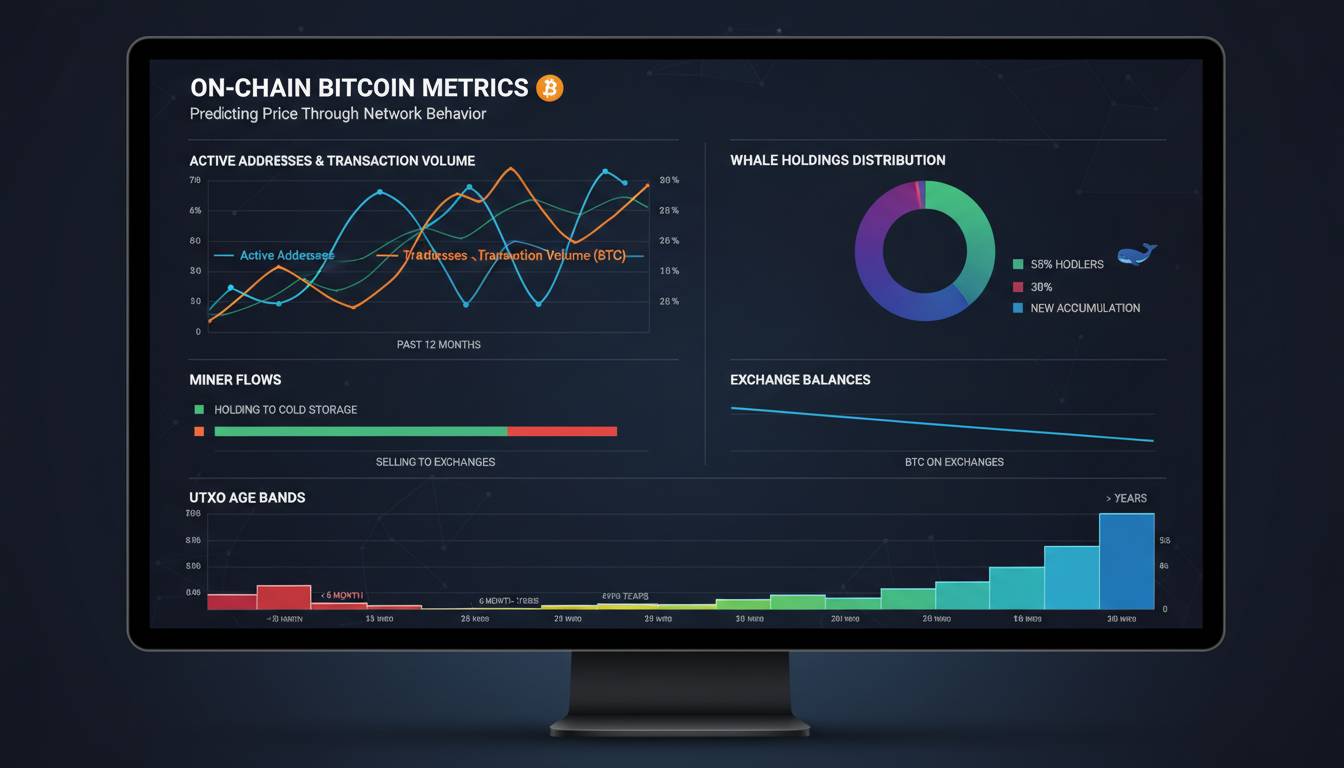
One of the most reliable on-chain metrics is the volume of Bitcoin flowing into exchange wallets. Exchanges are marketplaces — when large amounts of Bitcoin flow into hot wallets or deposit addresses, it typically means holders are preparing to sell.
During the May 2021 crash, exchange inflows spiked dramatically in the days leading up to the sell-off. Glassnode’s data showed exchange inflow volumes reached their highest level in months right before Bitcoin lost approximately 50% of its value in weeks. The on-chain data was flashing red while many retail traders were still buying the dip.
More recently, CryptoQuant has documented how exchange inflow spikes in late 2024 preceded several sharp corrections. The period leading into the late 2024 pullback showed exchange inflow volumes exceeding their 30-day moving average by a significant margin — often a precursor to accelerated selling pressure.
Contextualize these inflows against historical norms. A spike means little if isolated, but when exchange inflows trend upward while price is still rising or flatlining, that’s a divergence worth respecting. Tools like CryptoQuant’s Exchange Flow Ratio or Glassnode’s Exchange Net Position Change provide this data in near real-time. If you’re actively trading Bitcoin, checking exchange inflows should be part of your daily routine — it’s one of the few indicators that directly measures intent to sell.
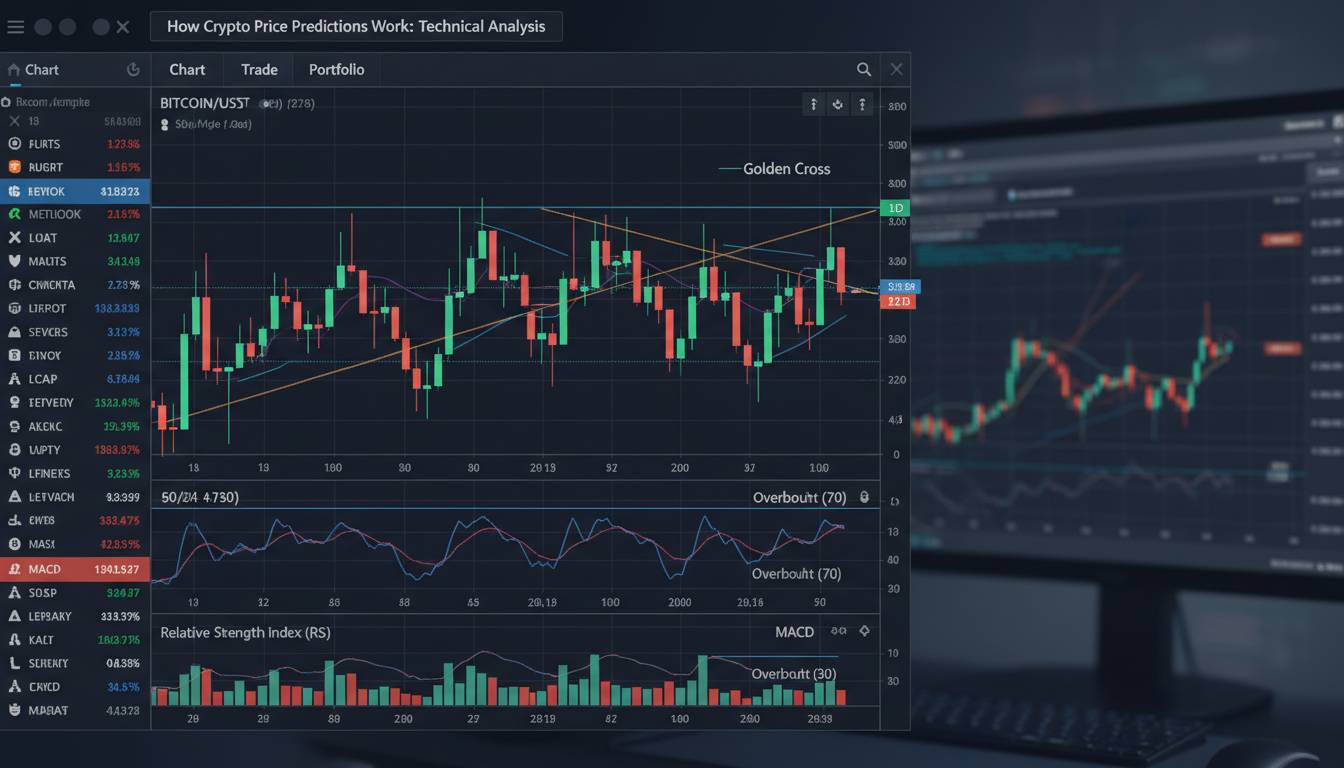
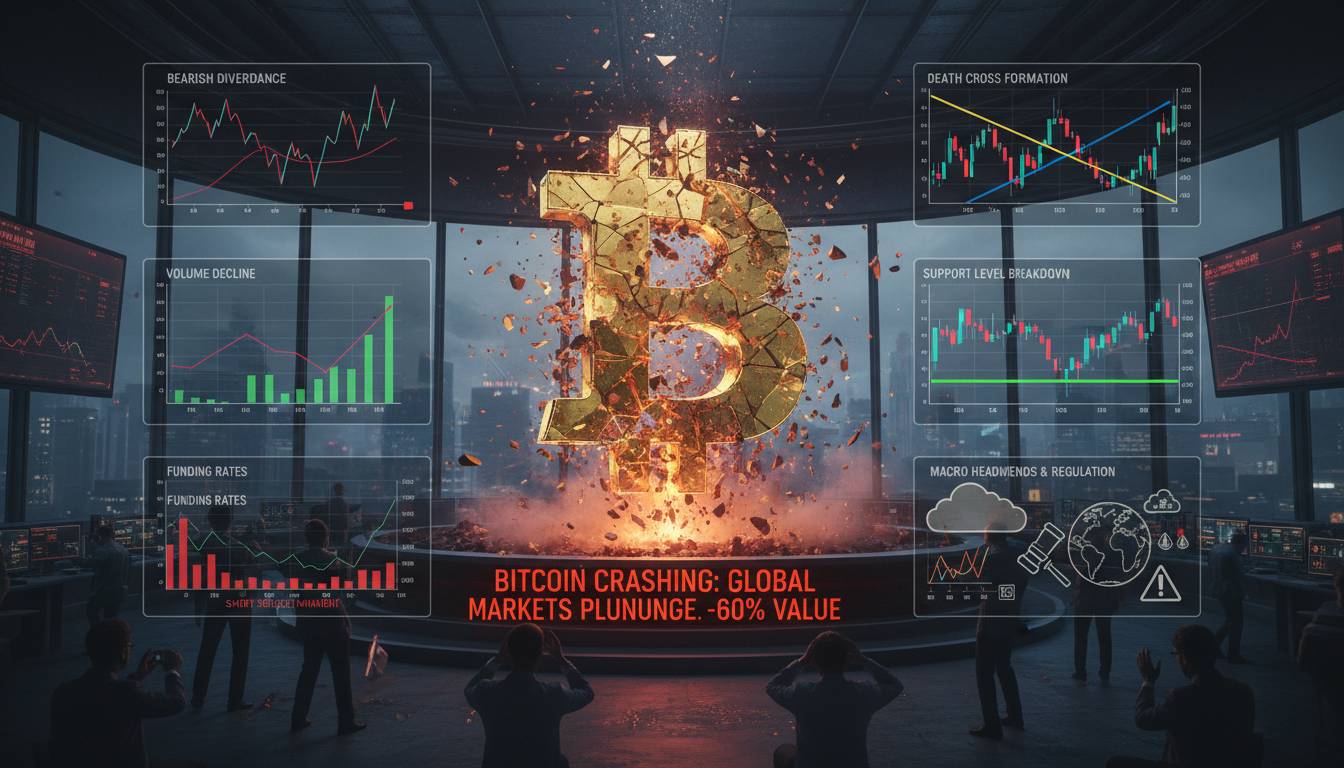
3. Technical Death Cross Formation
Technical analysis has its detractors, but the death cross — when a short-term moving average crosses below a long-term moving average — has a consistent track record in Bitcoin markets. The most watched version compares the 50-day moving average to the 200-day moving average, though shorter timeframes can generate earlier signals.
In January 2022, Bitcoin’s 50-day moving average crossed below its 200-day moving average on the daily chart. This death cross formed just above $40,000. Over the following twelve months, Bitcoin lost nearly 70% of its value, bottoming near $16,000. Traders who treated the death cross as a warning signal had roughly six weeks to reduce exposure before the bulk of the decline occurred.
The pattern repeated in early 2024, though the context differed. When the 50-day crossed below the 200-day in early February, Bitcoin traded around $42,000. The subsequent decline was more contained — roughly 20% — because the broader trend remained constructive. This highlights an important nuance: death crosses matter most after extended rallies and in bear market contexts. In bull markets, they often generate false signals or modest pullbacks.
Use a charting platform like TradingView or TradingSim to monitor the 50/200-day crossover on daily and weekly timeframes. When a death cross forms after a significant advance, treat it as a serious risk management trigger. It doesn’t mean panic-sell immediately, but it should prompt you to raise stop losses, reduce position sizes, or take profits on trailing positions. The cost of exiting too early is almost always less than the cost of riding a death cross confirmation into a 50% drawdown.
4. Whale Wallet Distribution
Large Bitcoin holders, commonly called whales, have information advantages and capital reserves that retail traders cannot match. Their behavior — specifically when they begin distributing holdings — often serves as a leading indicator for price declines. When whales move coins from cold storage to exchanges or directly to other wallets in patterns suggesting distribution, supply increases at the precise moment where demand is likely weakest.
Blockchain analytics firms have documented this phenomenon extensively. In the weeks leading up to Bitcoin’s November 2021 top, wallet clusters associated with long-term holders began systematically reducing positions. Whale alert services — which notify users of large transactions exceeding 100 BTC — showed unprecedented activity in the days surrounding the top. These alerts aren’t perfect signals alone — whales move coins for many reasons — but clustered activity around price extremes is meaningful.
Santiment has developed metrics tracking whale transaction volume and whale dominance. Their research indicates peaks in whale transaction activity frequently precede local price tops by 24 to 72 hours. During the late 2024 correction, Santiment’s data showed whale transaction volume spiking days before the sharpest decline, confirming large holders were actively distributing into strength.
You don’t need to become an on-chain analyst. Services like Whale Alert (on Twitter and Telegram) provide free notifications for large transactions across major blockchains. Watch for sustained increases in alert frequency, particularly when price is near local highs. A few large transactions mean little; a pattern of large transactions over days or weeks is a warning worth heeding.
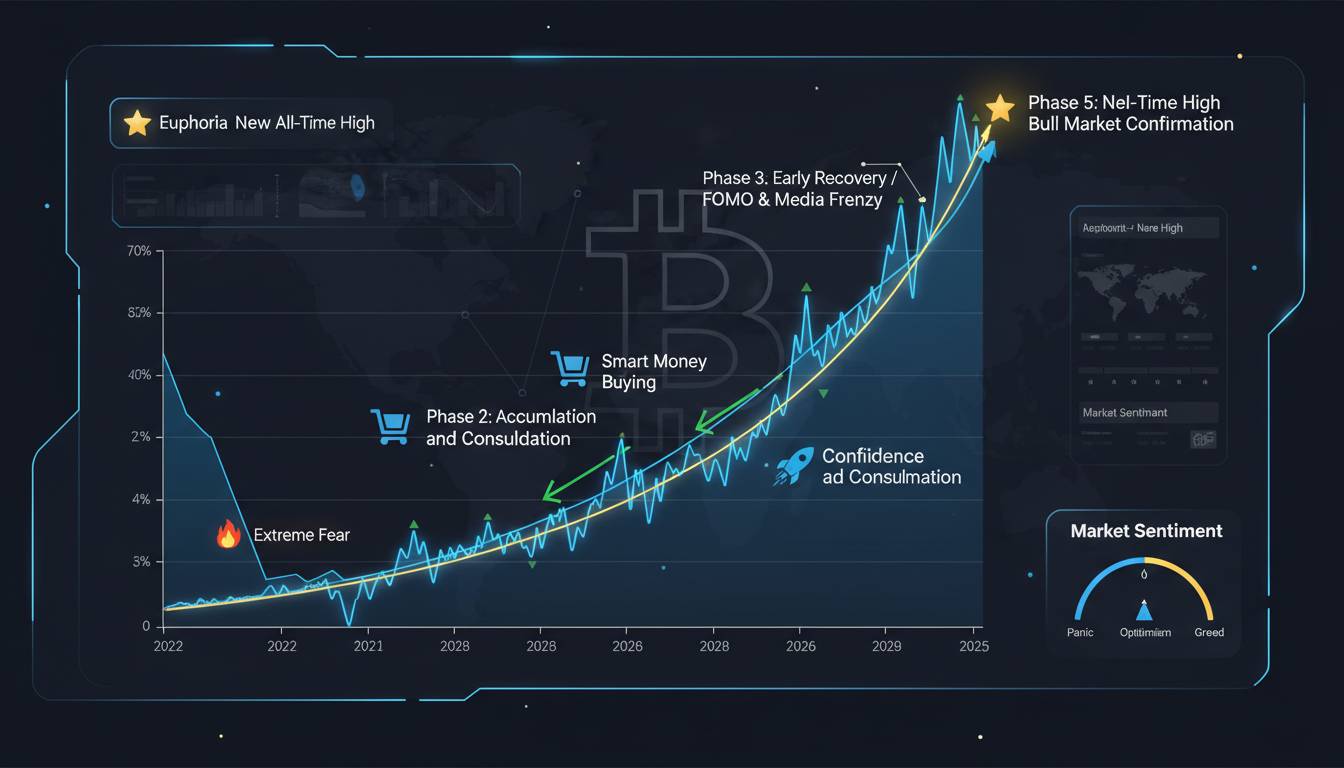
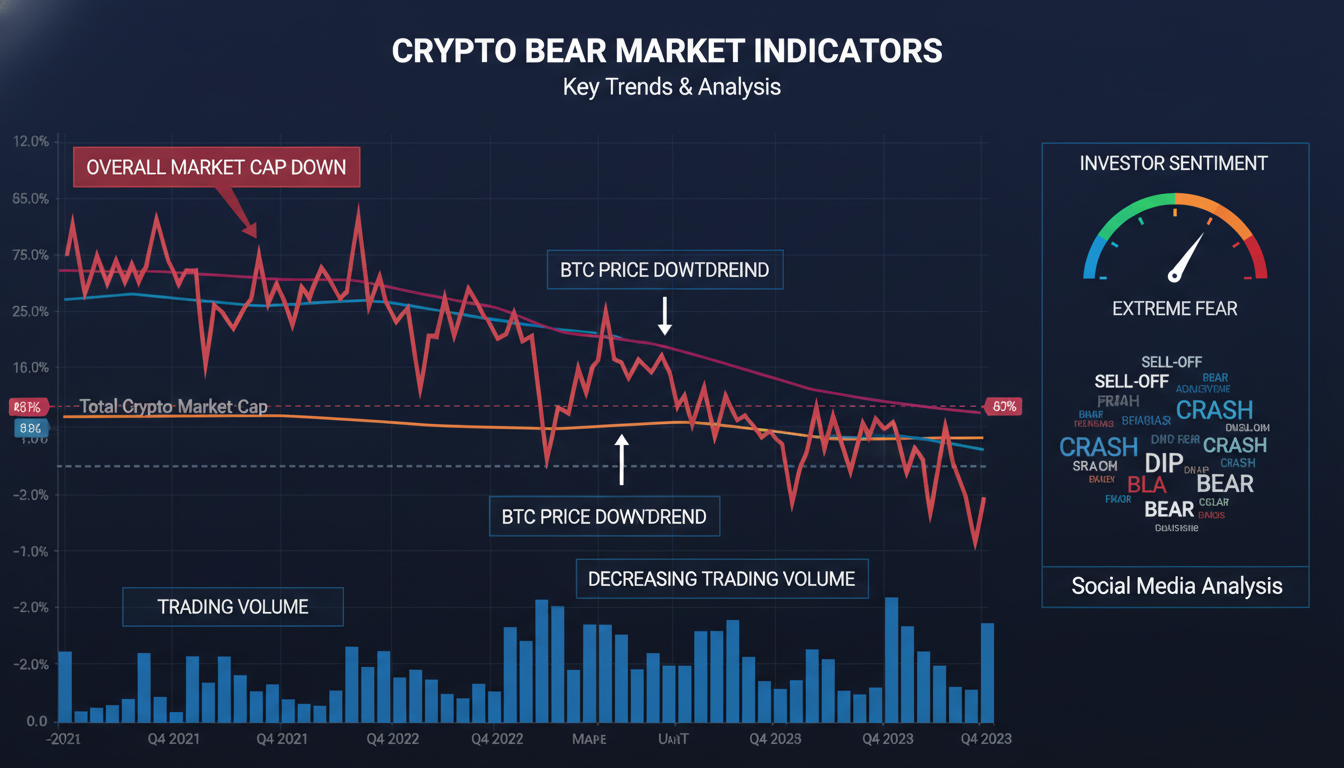
5. Market Sentiment Reaches Extreme Greed
The Crypto Fear and Greed Index aggregates multiple data sources — volatility, social media volume, surveys, market momentum — to produce a single number from 0 (extreme fear) to 100 (extreme greed). The index’s value is contrarian application — extremes mark turning points.
The index hit 79 in early November 2021, firmly in “extreme greed” territory. Bitcoin peaked at approximately $69,000 two weeks later and began its descent. Similarly, the index reached 77 in March 2024 as Bitcoin pushed toward its cycle highs. While the subsequent correction was shallower, the sentiment extreme still preceded a meaningful pullback. The pattern isn’t perfect — the index can remain in greed territory for weeks during strong trends — but sustained readings above 75 should put every trader on alert.
Sentiment extremes are accessible. The Fear and Greed Index updates daily and requires no technical setup. Find it on multiple websites with a simple search. The practical application isn’t predicting exact tops but maintaining awareness of risk-reward dynamics. When everyone around you is greedy, your risk of loss is highest — not because the market can’t go higher, but because the easy money has already been made.
A genuine limitation: sentiment indicators work best as warning signs rather than timing tools. The market can remain irrational longer than anyone expects, and extreme greed can persist through additional rallies. Use these readings to tighten risk management parameters rather than to initiate short positions. The cost of being early to a contrarian play is usually higher than the cost of waiting for additional confirmation.
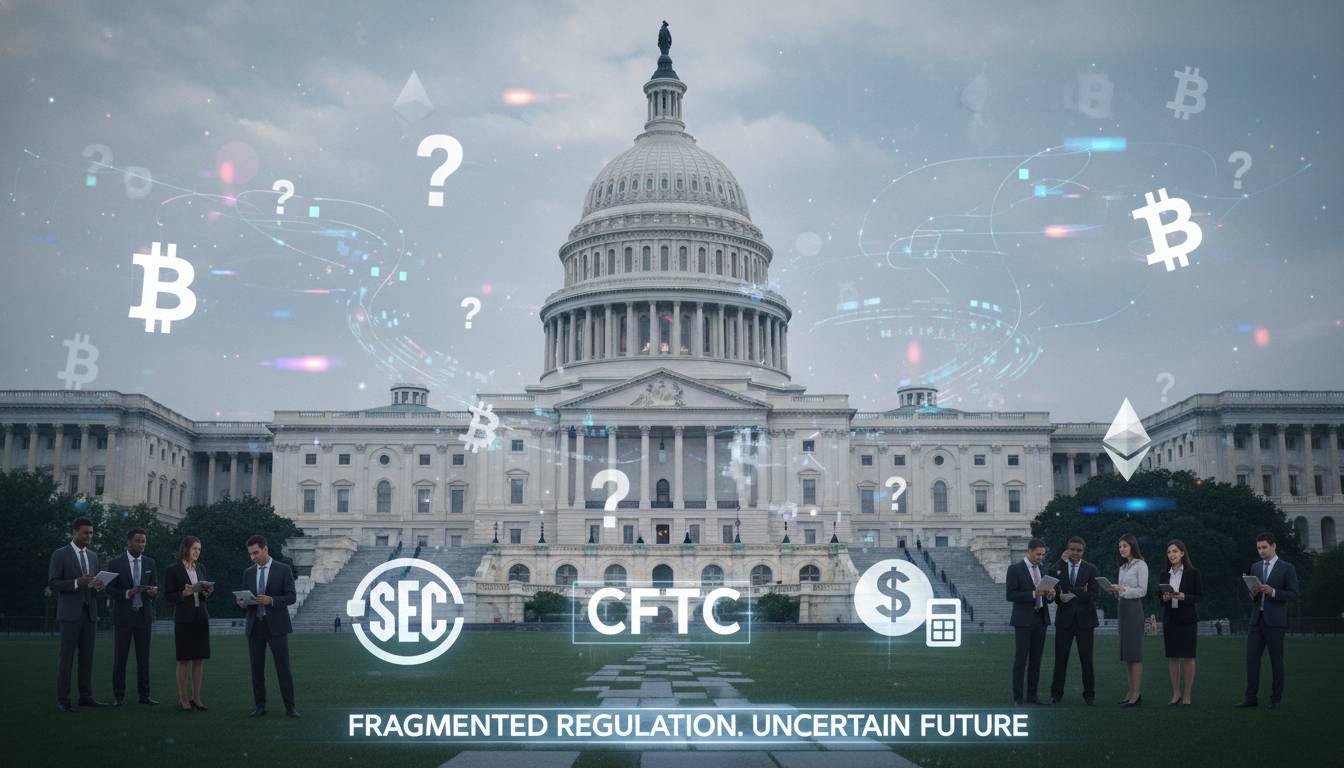
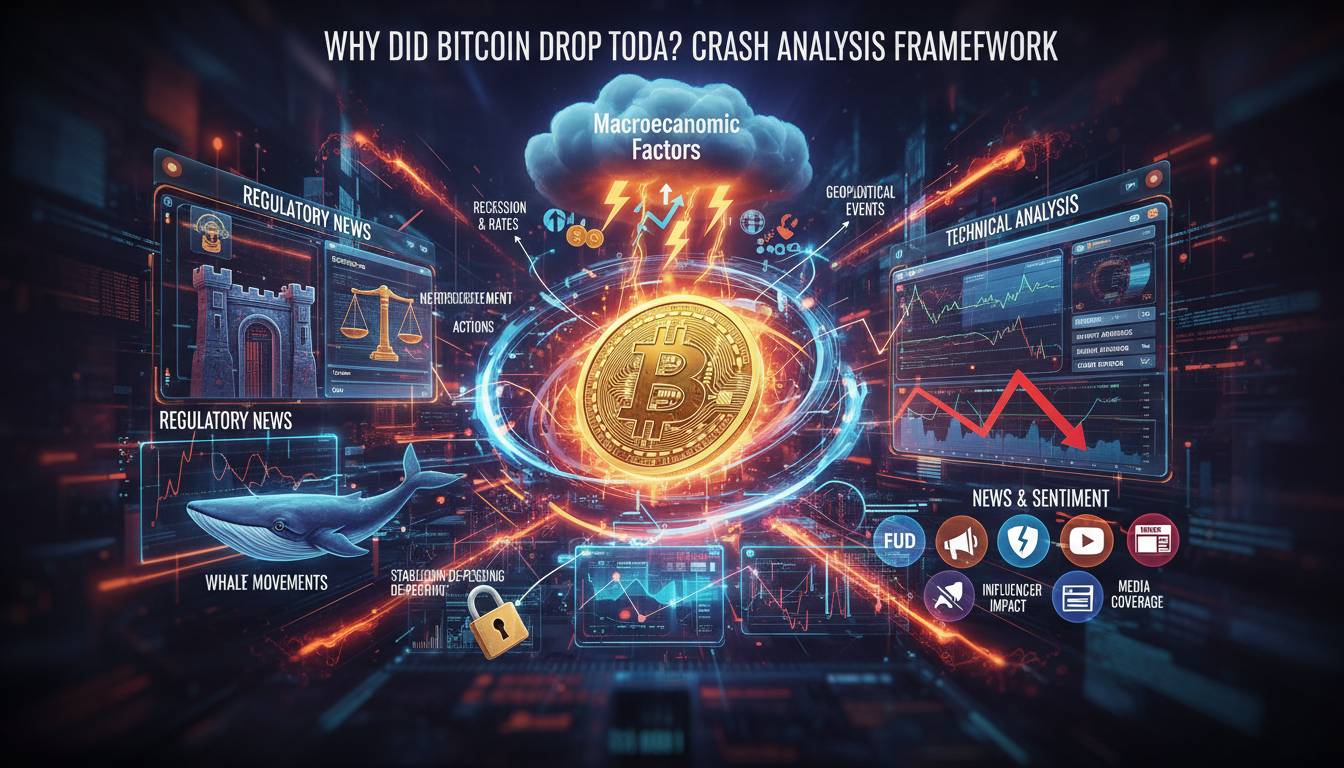
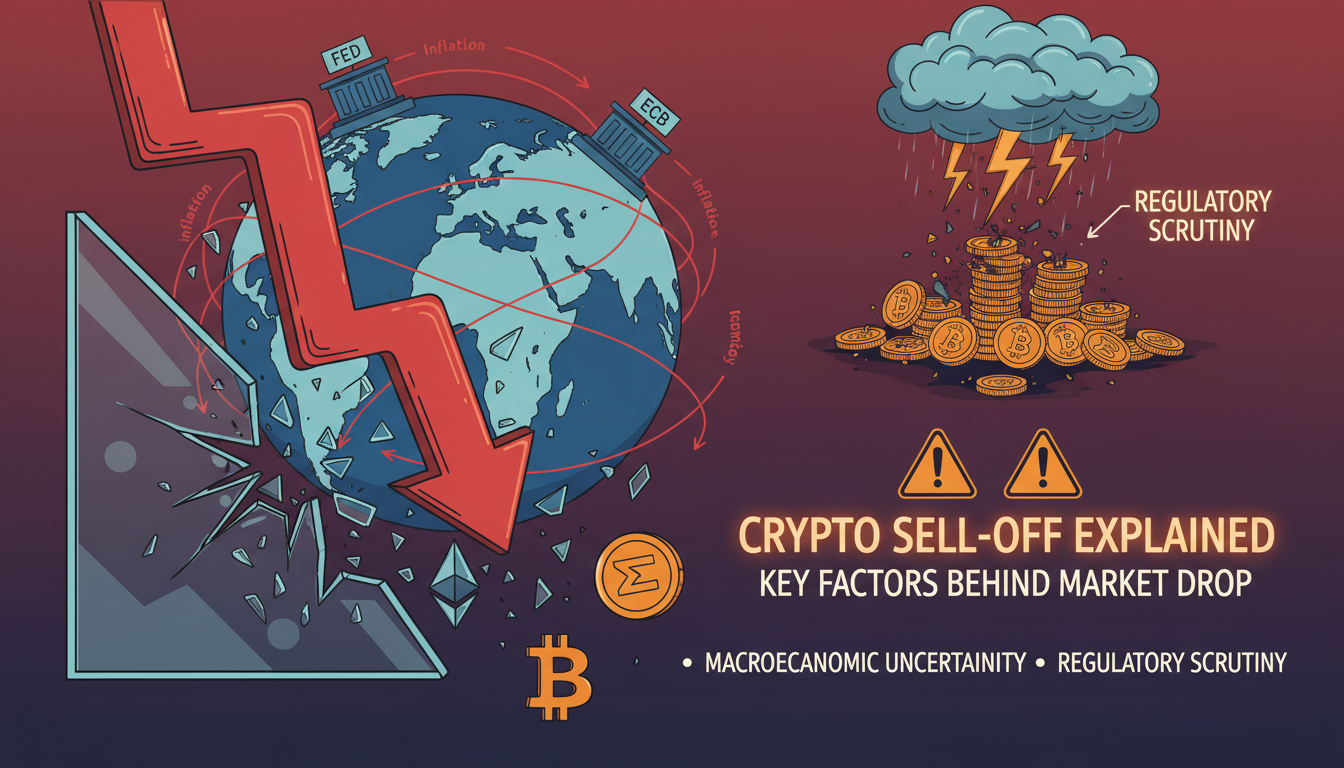
6. Regulatory or Macro Shock Announcement
Bitcoin doesn’t trade in a vacuum. While the asset has demonstrated remarkable resilience over time, major drawdowns frequently coincide with regulatory announcements or shifts in macroeconomic conditions. These events are inherently unpredictable in timing, but their impact is well-documented — they often produce the most violent and least predictable crashes.
The May 2021 crash was partially triggered by China’s renewed crackdown on cryptocurrency mining and trading. Within weeks, major Chinese mining operations were forced offline, hash rate dropped dramatically, and selling pressure intensified as miners liquidated holdings. Bitcoin lost roughly 50% of its value in weeks. Those monitoring regulatory developments in China had weeks of warning — Chinese officials had been signaling tighter restrictions since early 2021.
More recently, the SEC’s actions against major exchanges and stablecoin issuers have created periodic shockwaves. The filing of enforcement actions against Coinbase and Binance in 2023 triggered sharp, if temporary, declines. While these events are difficult to predict precisely, they share common precursors: increased regulatory rhetoric, leaked documents, or unusual trading activity in stablecoins suggesting insider knowledge.
The practical takeaway is not to predict regulatory events — that’s essentially impossible — but to maintain position sizing that can withstand a sudden 30% to 50% drop. If your portfolio cannot survive a regulatory shock, you are over-leveraged regardless of how bullish your analysis is. The best protection against macro shocks is financial discipline: never allocate more to Bitcoin than you can afford to lose entirely, and maintain sufficient liquidity to weather extended drawdowns without being forced to sell.
What to Do When Warning Signs Accumulate
Reading warning signs is only half the battle. The more difficult challenge is acting on them when everything around you is bullish and everyone is telling you Bitcoin is going to $100,000. The psychological pressure to ignore risk signals during a bull market is enormous, which is why most traders fail to protect their capital when it matters most.
Establish risk management rules before you need them. Decide in advance what combination of warning signs will trigger position reduction, and write those rules down. When the indicators trigger, follow the plan — don’t negotiate with yourself in real-time. The market will always provide reasons to stay invested; your job is to protect capital when the evidence suggests otherwise.
Consider using trailing stop losses. These allow you to capture upside while automatically locking in profits if price reverses by a predetermined percentage. As Bitcoin makes new highs, your stop loss rises with it, ensuring you participate in rallies while exiting cleanly if the trend breaks.
No single indicator is infallible. The six warning signs here are most powerful in combination. A death cross alone might generate a shallow correction; add extreme funding rates and exchange inflow spikes, and the probability of a significant decline rises substantially. Develop the habit of looking at multiple indicators in context rather than trading on any single signal.
Accept that you will sometimes exit positions early. This is the cost of surviving major crashes. Missing the last 10% of a rally is infinitely better than losing 50% of your capital in a crash you failed to anticipate. Protecting your downside is what enables you to participate in the next rally.
Looking Forward
The cryptocurrency market will continue its volatility. New participants will arrive during bull phases, experience their first major drawdown, and either learn to respect warning signs or exit the space permanently. The six signals outlined here — extreme funding rates, exchange inflow spikes, death cross formations, whale distribution patterns, sentiment extremes, and macro regulatory shocks — have preceded most major corrections in Bitcoin’s history.
Whether these patterns continue to work as the market matures is genuinely unresolved. Institutional participation has changed some dynamics, and the next major crash may not follow historical scripts precisely. On-chain metrics that worked in 2017 may be less effective as large holders develop more sophisticated strategies. The death cross, while historically reliable, has generated more false signals in recent years as algorithmic trading reshapes market dynamics.
What hasn’t changed is human psychology. Greed drives markets to extremes, leverage accumulates until it cannot sustain, and large players distribute to less sophisticated buyers at the top. These behaviors are timeless. The indicators may evolve, but the underlying signals will persist in some form. Your job as a participant in this market is to remain humble, respect the warning signs, and prioritize capital preservation over FOMO-driven accumulation. The next crash will come — and those who have prepared will be positioned to survive it.