The Bitcoin halving is a technical event with significant market implications. Every four years, the reward paid to Bitcoin miners gets cut in half, theoretically creating supply pressure that pushes prices upward over the following months. This pattern held for three complete cycles: 2012-2016, 2016-2020, and 2020-2024. But the market that just experienced its fourth halving in April 2024 looks different from the one that existed in 2012, when Bitcoin was a niche experiment trading below $15. With institutional investors now holding billions in Bitcoin, exchange-traded funds driving major capital flows, and regulatory frameworks taking shape across major economies, the question is straightforward: does the 4-year cycle still work, or has Bitcoin matured beyond this predictable rhythm?
The answer matters. If the cycle holds, we’re currently in the “markup” phase—the period historically associated with the most aggressive price appreciation. If it doesn’t, investors relying on cycle timing could be caught in a painful false assumption. After years of analyzing on-chain data and market structures, what I see is more nuanced than a simple “yes” or “no.” The halving still creates real supply-side pressure, but the market’s response mechanisms have evolved in ways that challenge simple cycle extrapolation. Here’s what I think is actually going on.
How Bitcoin’s Halving Mechanism Works
The Bitcoin protocol reduces miner rewards by 50% approximately every 210,000 blocks—roughly four years. When Satoshi Nakamoto designed this mechanism, the goal was straightforward: control inflation and mimic the scarcity dynamics of precious metals like gold. New Bitcoin enters circulation only through mining, and the halving steadily reduces the flow of new supply.
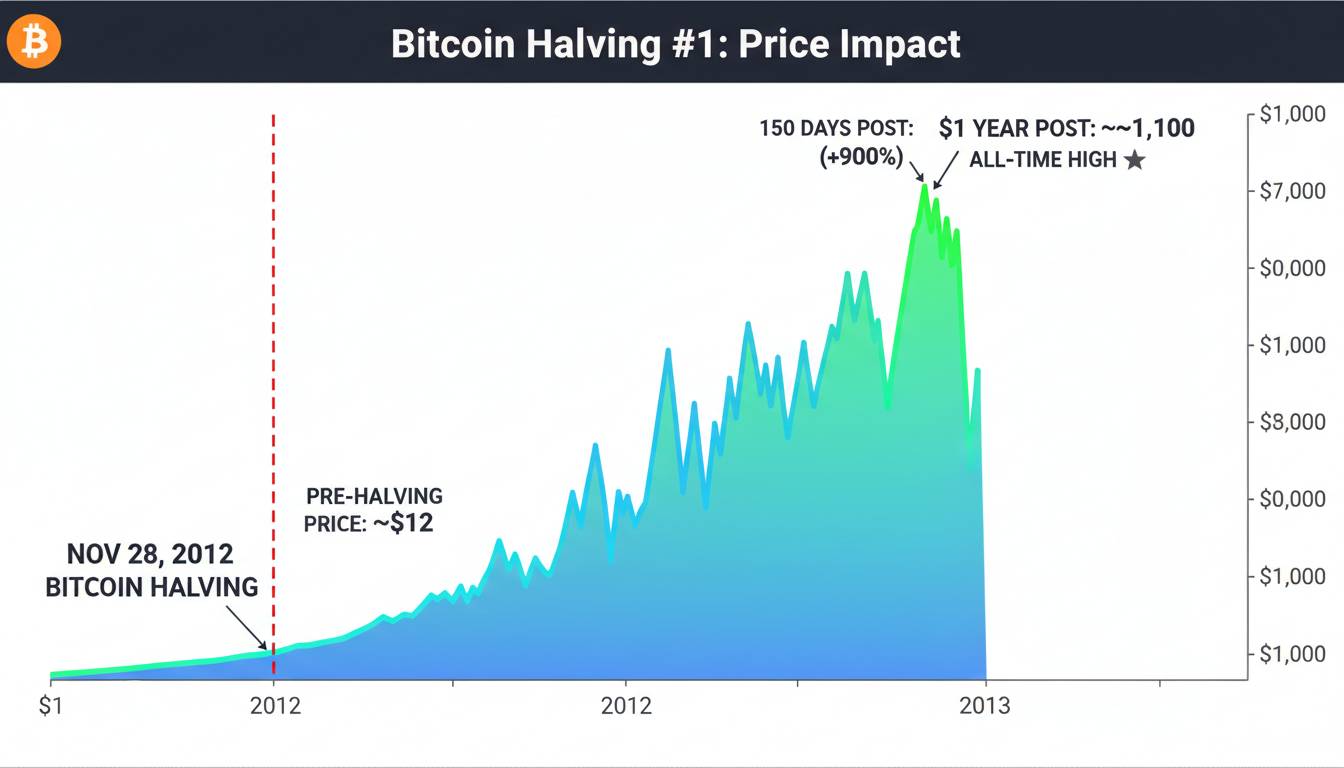
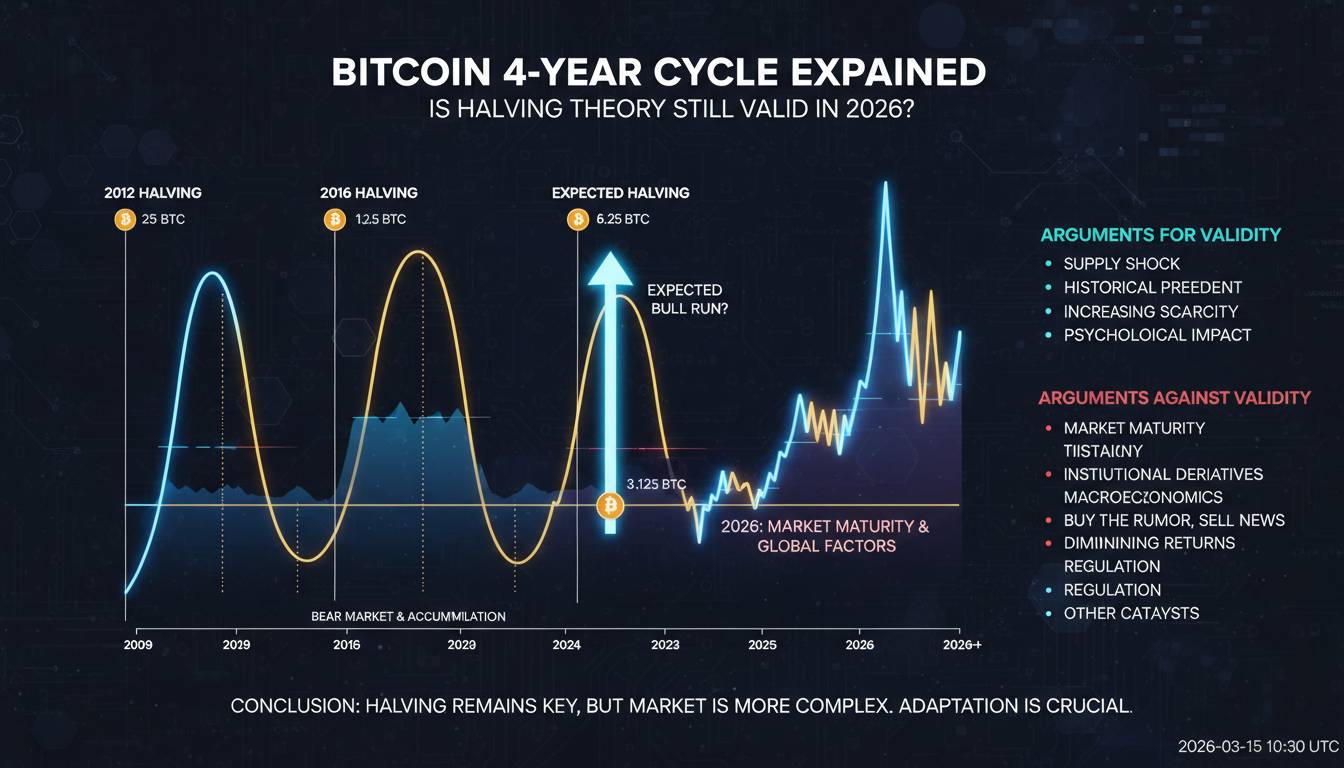
In 2009, miners received 50 BTC per block. After the first halving in November 2012, that dropped to 25 BTC. The July 2016 halving reduced it to 12.5 BTC, the May 2020 halving to 6.25 BTC, and the most recent halving in April 2024 brought block rewards down to 3.125 BTC. Roughly 19.5 million of the 21 million total Bitcoin have already been mined, with the final coins scheduled to come into existence around 2140.
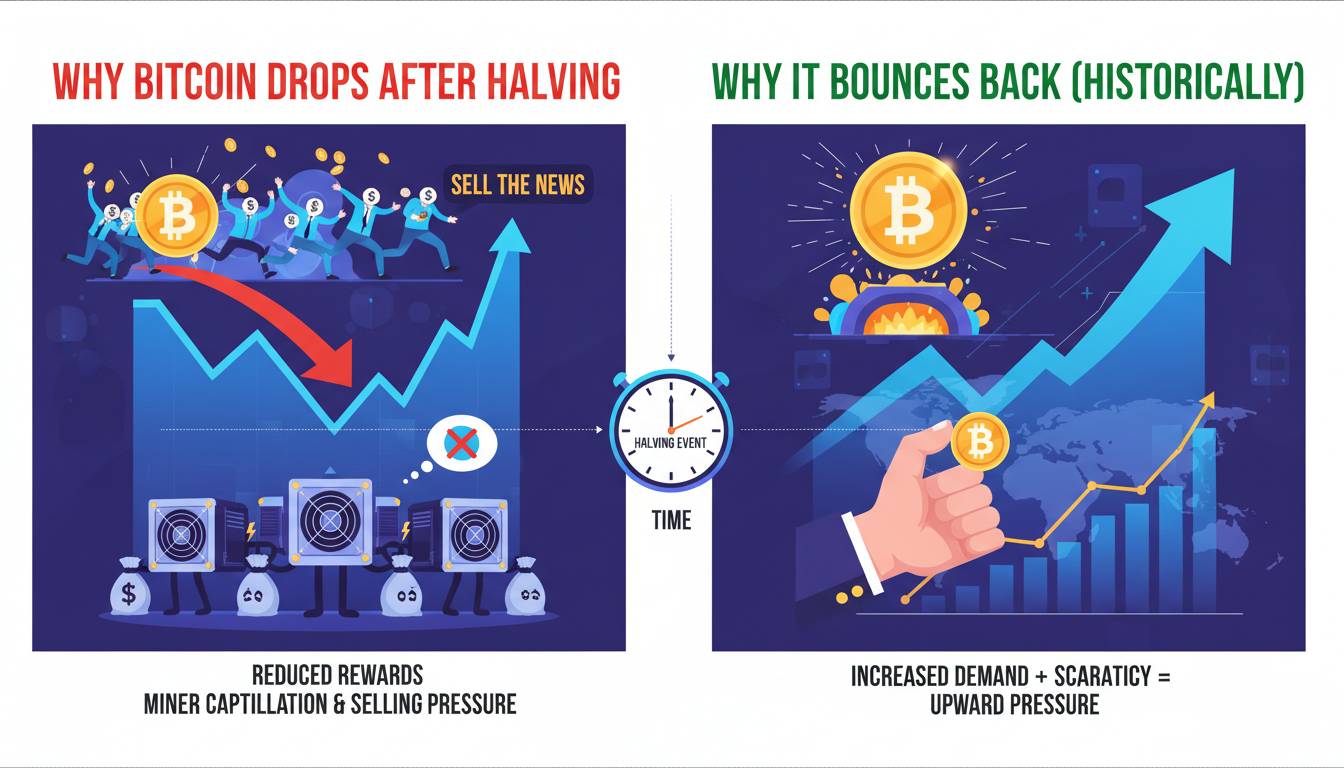
The supply shock theory that underpins the cycle narrative works like this: if demand remains constant or grows while new supply gets cut in half, prices must rise. Miners face higher costs per Bitcoin produced, and some exit the network during the adjustment period, further reducing sell pressure from newly minted coins. In previous cycles, this dynamic played out with remarkable consistency—substantial price run-ups occurred 12-18 months after each halving.
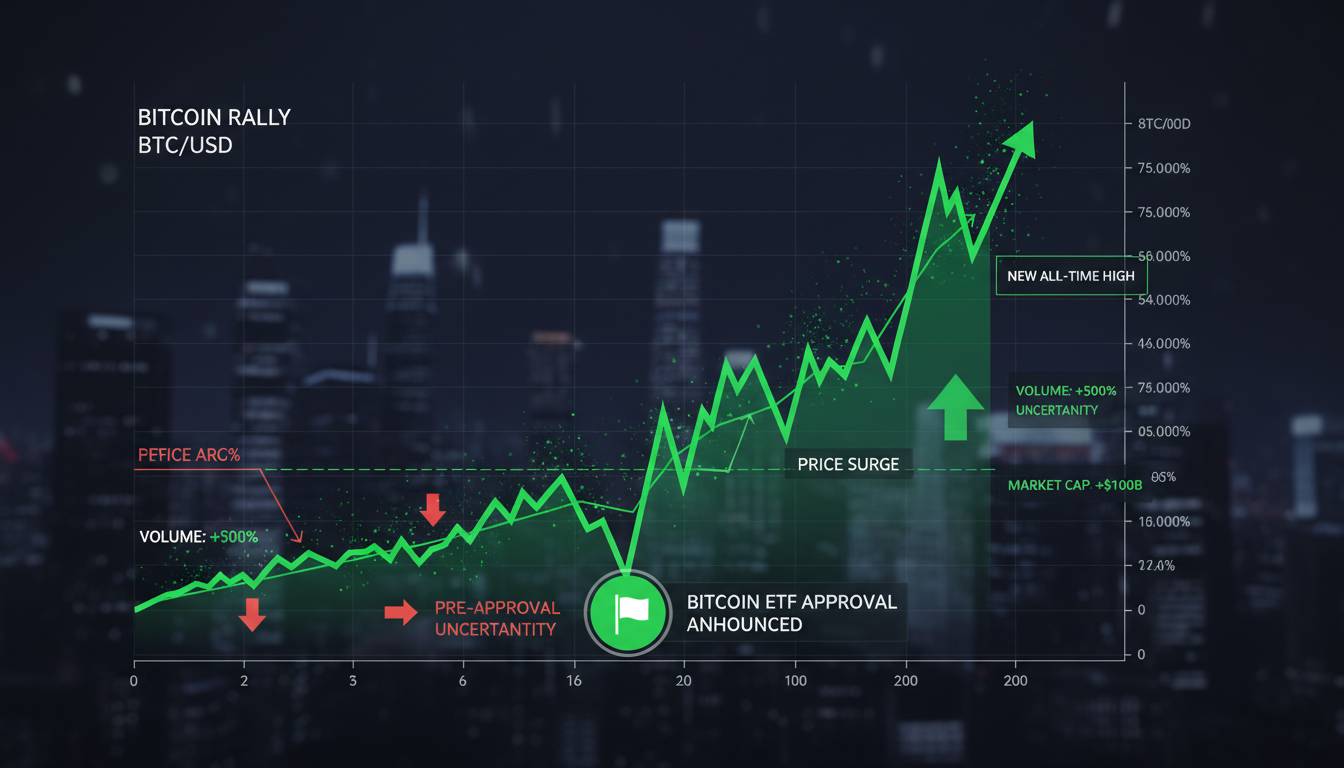
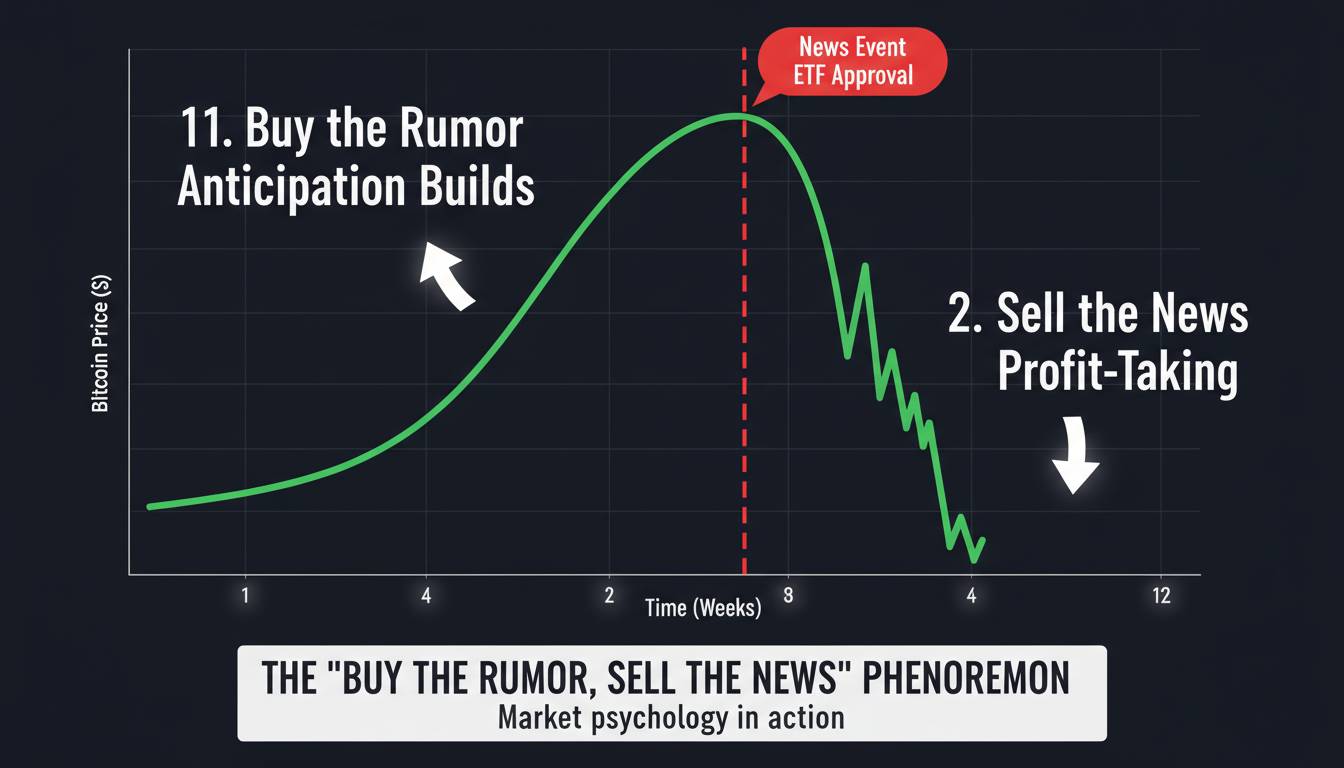
Here’s the nuance that cycle proponents often gloss over: the halving is entirely predictable. Unlike gold, which has no formal schedule for new supply reductions, Bitcoin’s algorithm guarantees exactly when the halving will occur. This means markets can and do price in the event well in advance. By the time the halving actually happens, much of the anticipated supply shock has already been absorbed into current prices. The 2024 halving illustrates this—Bitcoin reached new all-time highs above $100,000 in late 2024 before the halving even occurred, suggesting the market had already factored in the reduced supply flow.
The Four Phases of Bitcoin’s Market Cycle
Understanding why the 4-year cycle has historically worked requires examining each phase and what drives transitions between them.
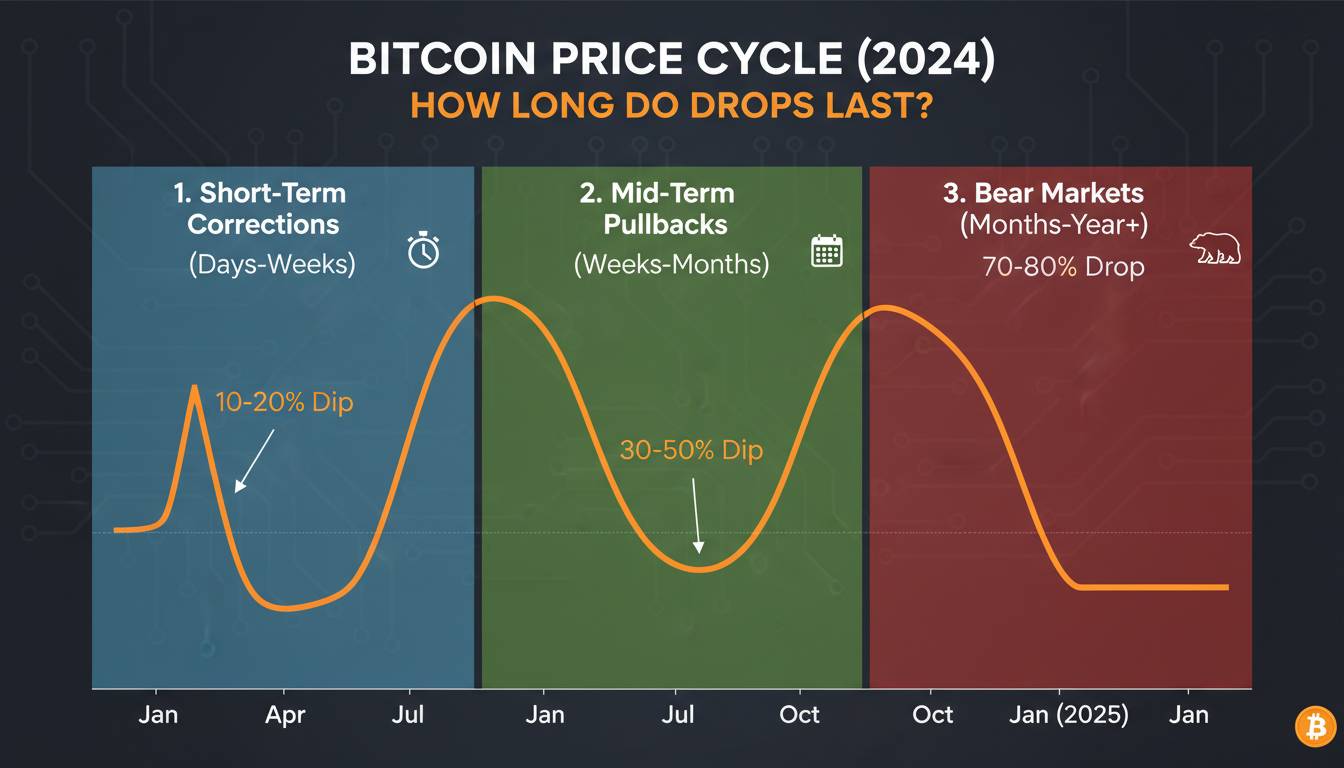
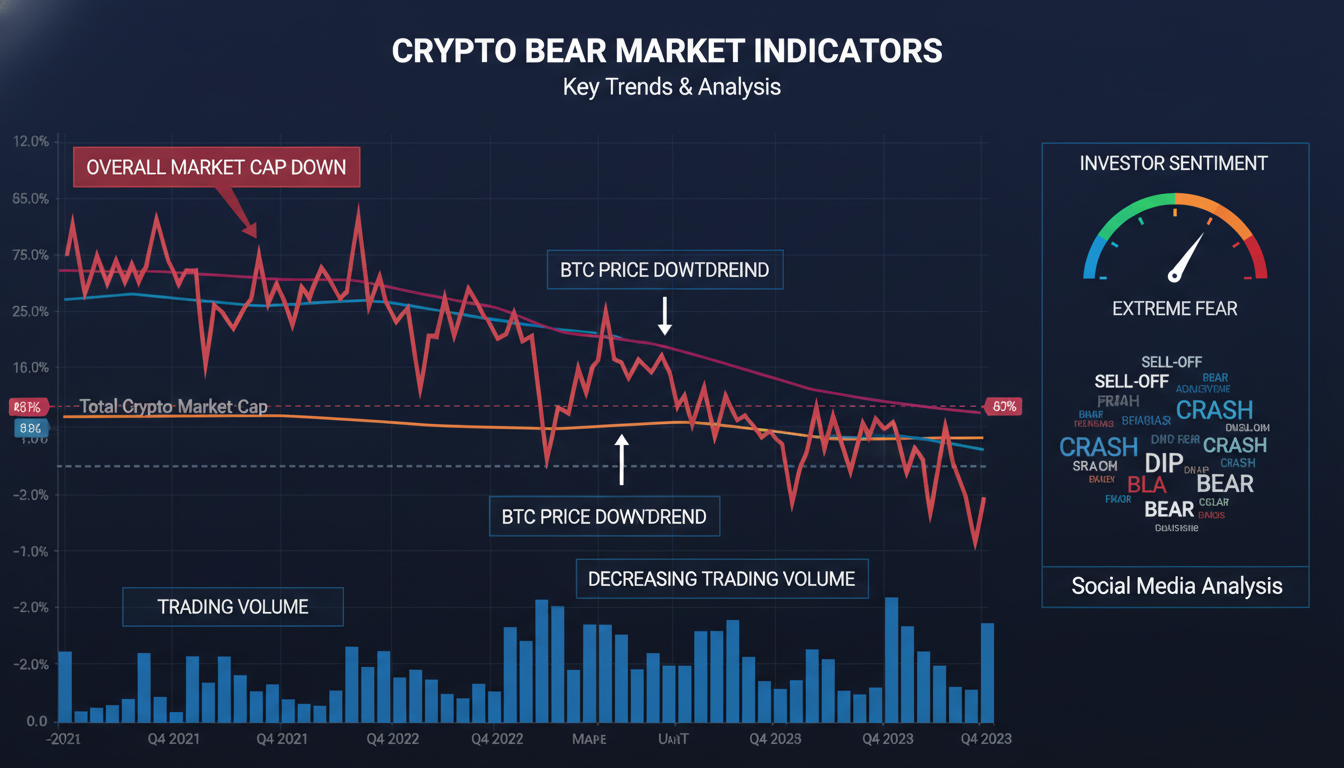
Accumulation typically follows the bottom of a bear market, when sentiment is maximally negative and weak hands have been shaken out. This phase can last months or even a year, characterized by low volatility and sideways price action. Smart money accumulates quietly during this period. In the 2022-2023 cycle bottom, this dynamic was visible as long-term holders continued accumulating despite crashed prices and pervasive negativity.
Markup is the phase most investors think about when they discuss Bitcoin cycles—the period of aggressive price appreciation that follows accumulation. This typically begins 6-12 months after the halving and can last 12-18 months, characterized by increasing volume, media attention, and retail participation. The markup phase ends when prices reach new highs and distribution begins as early investors take profits.
Distribution marks the transition from bull to bear, when smart money begins systematically selling positions accumulated during the accumulation phase. This phase often features confusing price action—new highs that fail to hold, increasing volatility, and growing divergence between price and on-chain metrics like exchange flows. Many investors mistake early distribution for the start of a new accumulation phase.
Decline is the bear market that follows distribution, characterized by cascading sell pressure as levered positions get liquidated and sentiment shifts from greed to fear. The decline phase typically bottoms when capitulation occurs—when even strong hands are forced to sell due to margin calls or loss of conviction. This capitulation marks the beginning of a new accumulation phase.
The problem is that while these phases are conceptually clear in hindsight, identifying them in real-time is extraordinarily difficult. The boundaries between phases are fuzzy, and what looks like distribution in retrospect might feel like a healthy correction in the moment. I’ve seen sophisticated traders misidentify cycle phases repeatedly, confusing correction for capitulation or distribution for accumulation.
Historical Performance: What the Data Shows
Let’s look at what actually happened in each cycle, because the commonly cited numbers often obscure important nuances.
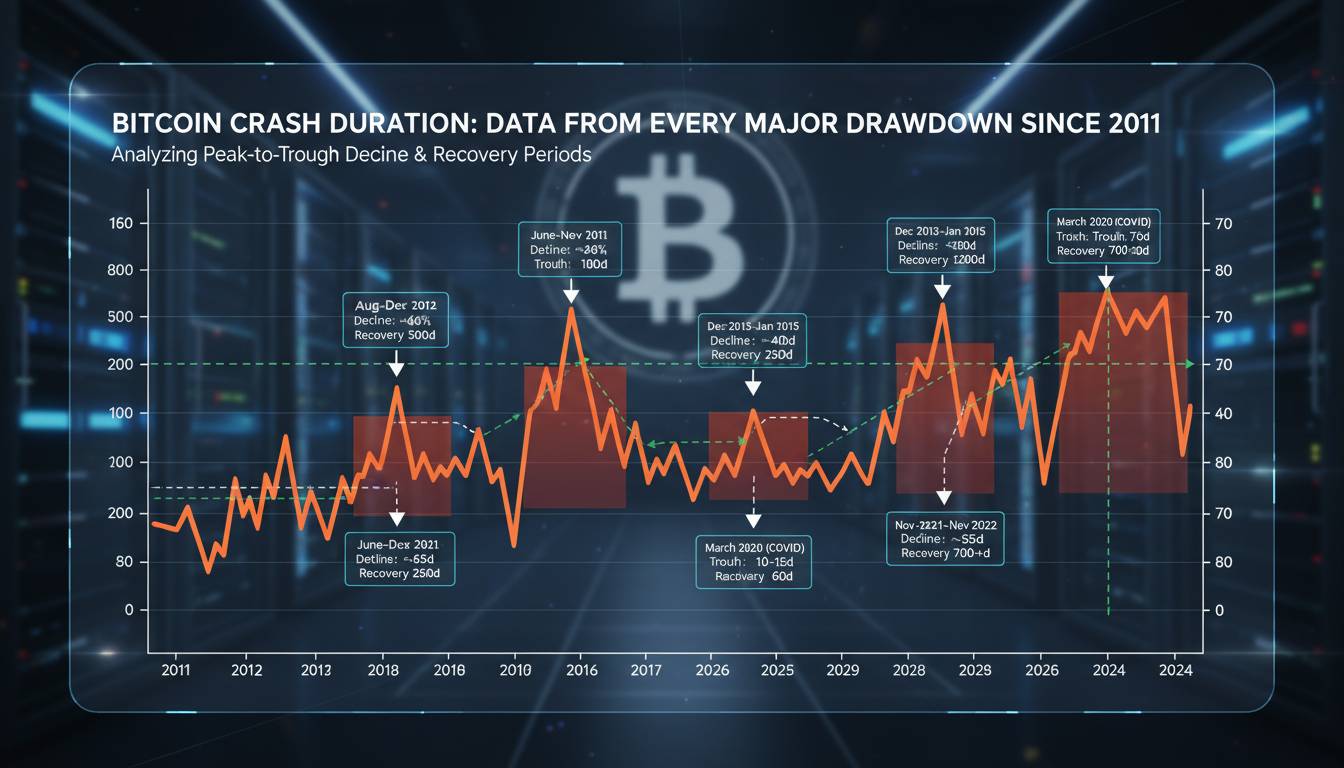
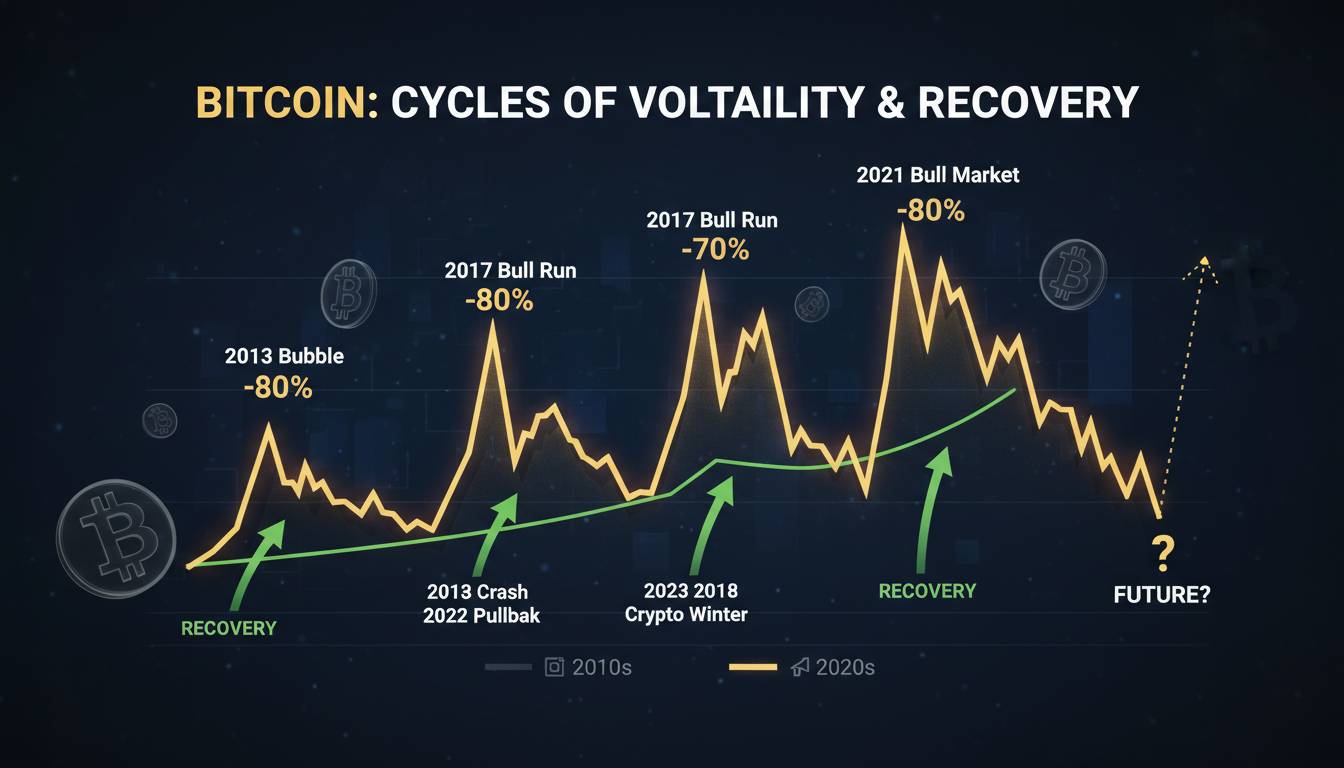
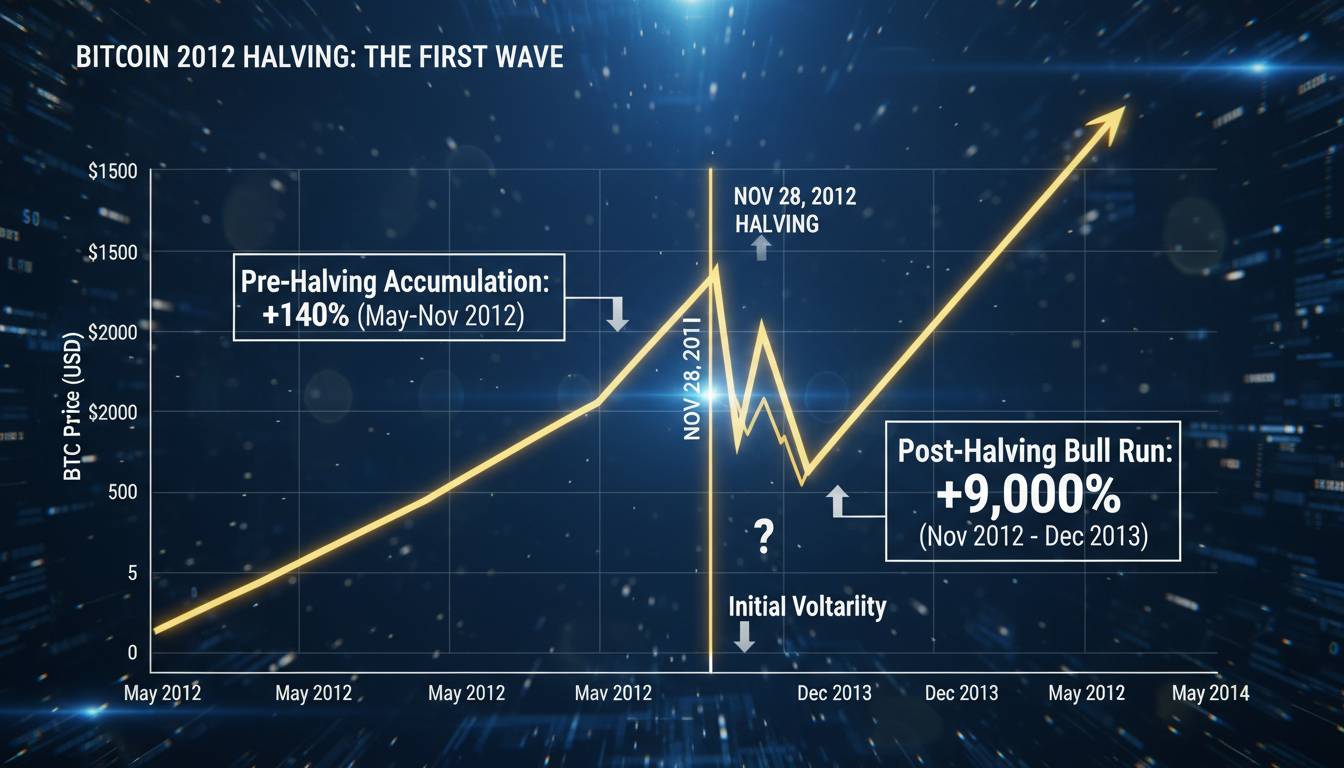
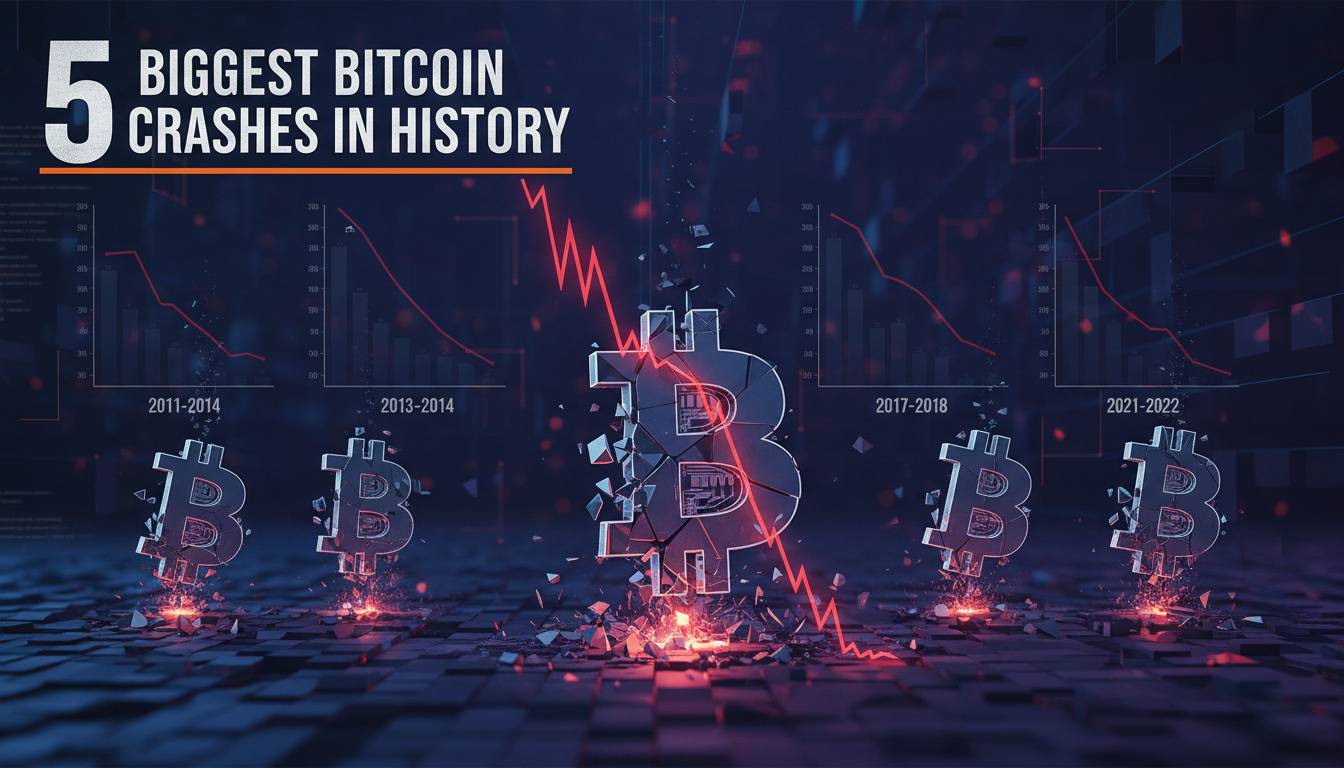
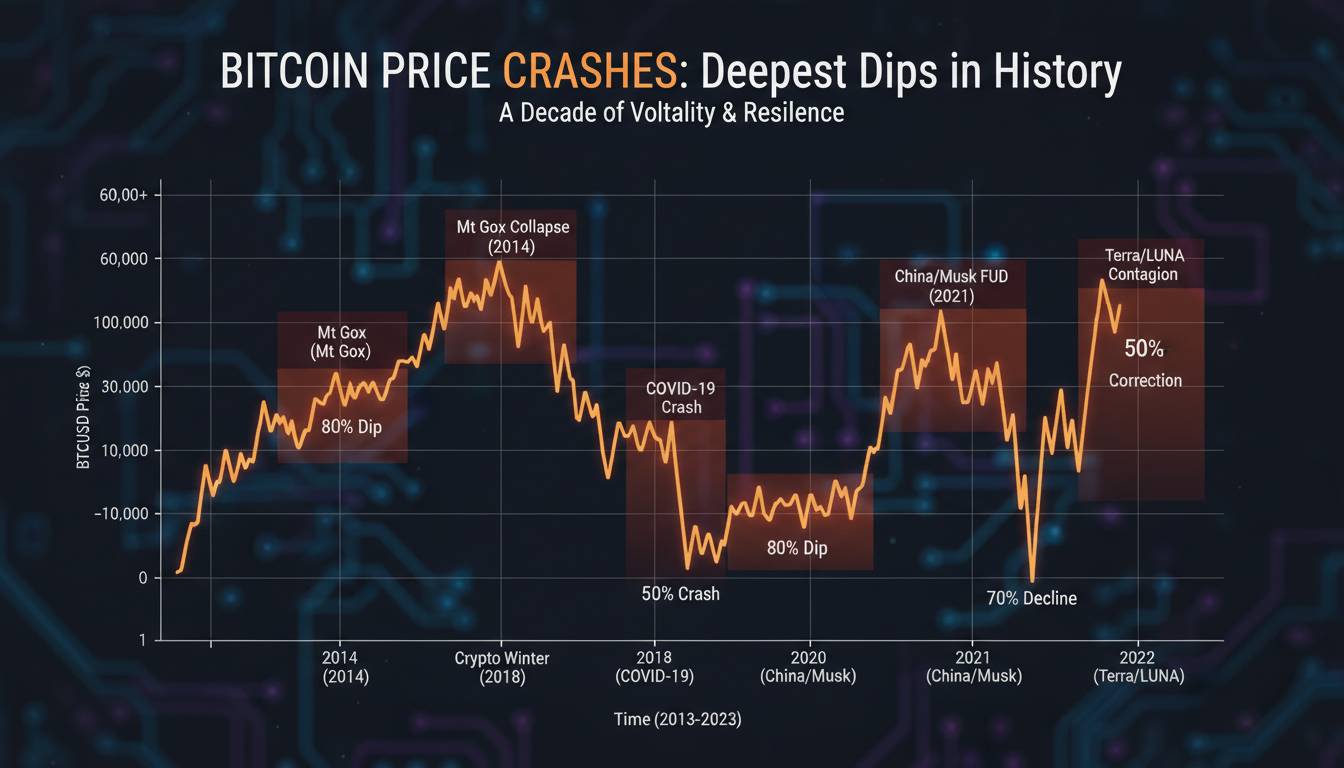
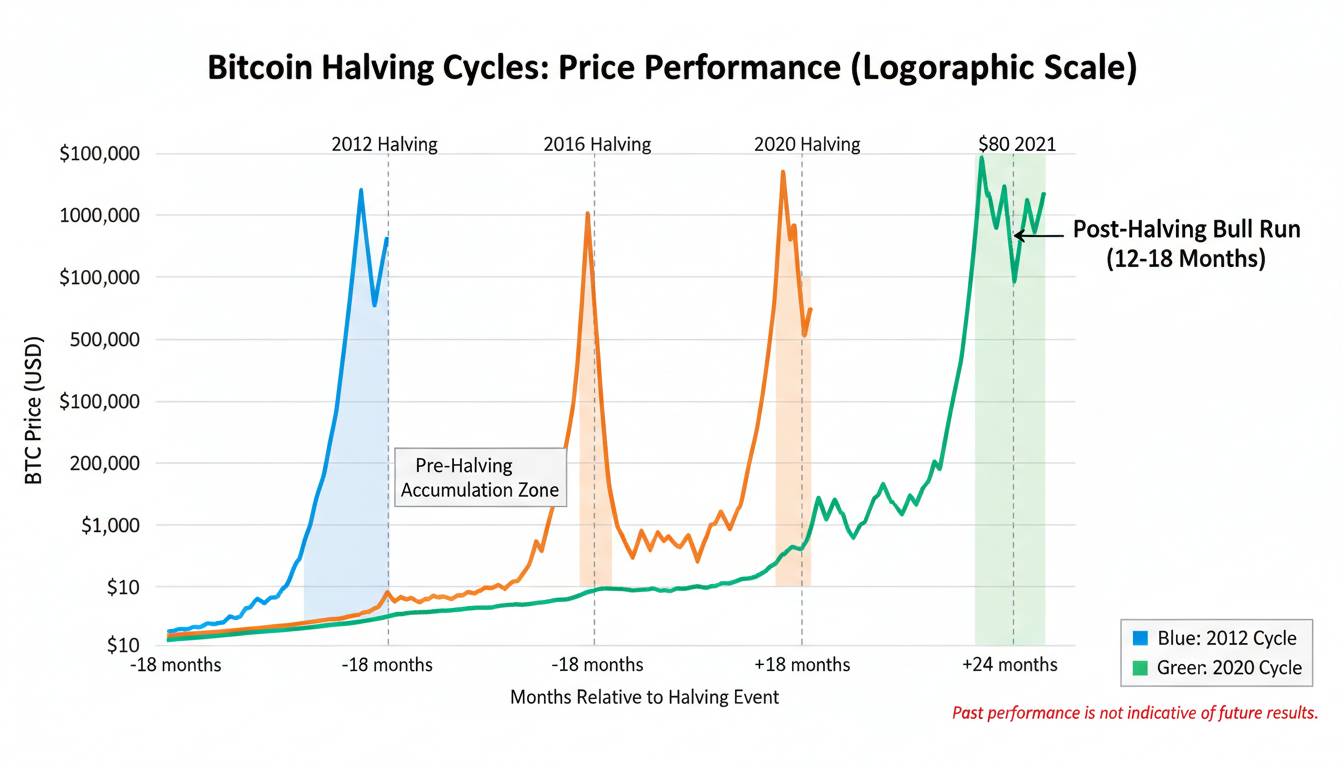
Cycle 1 (2012-2016): The November 2012 halving preceded a rise from approximately $12 to nearly $1,200—a 100x increase over roughly three years. The subsequent bear market brought prices down to around $200 by early 2015, an 83% drawdown. This cycle established the template that would define Bitcoin investing for the next decade.
Cycle 2 (2016-2020): The July 2016 halving was followed by a rise from roughly $650 to the December 2017 peak of nearly $20,000—a 30x increase. The subsequent bear market bottomed at approximately $3,200 in December 2018, an 84% drawdown. This cycle was notable for the emergence of initial coin offerings and significant retail speculation.
Cycle 3 (2020-2024): The May 2020 halving occurred during the COVID-19 market dislocation, with Bitcoin having already crashed from $14,000 to under $4,000 in the preceding weeks. From that low point, prices rose to approximately $69,000 in November 2021—a 17x increase from the pre-halving level. The subsequent bear market bottomed around $15,500 in late 2022, a 77% drawdown.
Cycle 4 (2024-2028): The April 2024 halving occurred with Bitcoin already above $60,000, having recovered substantially from the 2022 lows. By late 2024, Bitcoin surpassed $100,000 for the first time, and into early 2025, prices continued climbing toward $120,000. Whether this represents the markup phase of a new cycle or something different is the central question this article addresses.
What’s immediately apparent is that while the general pattern of post-halving appreciation holds, the magnitude of each cycle has diminished. The 100x return of Cycle 1 gave way to 30x in Cycle 2 and 17x in Cycle 3. This makes intuitive sense: as the market cap grows from hundreds of millions to hundreds of billions, percentage gains naturally compress. A 17x return from the 2020 cycle low still represented $700 billion in added market value—a magnitude impossible to sustain at the scale Bitcoin has reached.
Is the 4-Year Cycle Still Valid in 2026?
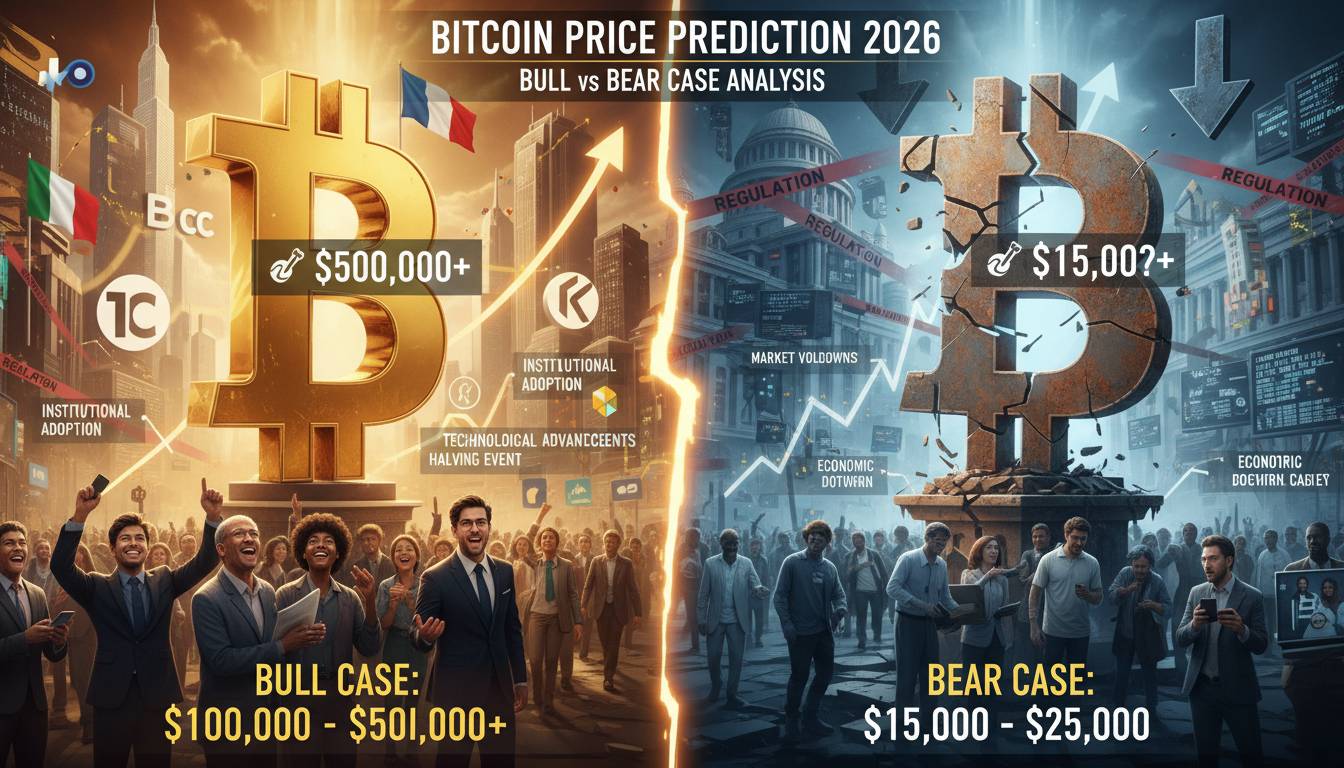
Here’s my honest assessment: the answer is less straightforward than either bulls or bears would prefer. Let me lay out the case for and against cycle validity.
The case for continuation: The fundamental mechanism—halving-driven supply reduction—hasn’t changed. The April 2024 halving reduced new Bitcoin supply from approximately 900 BTC daily to about 450 BTC. At current prices, that’s roughly $50 million less sell pressure entering the market every day from miner rewards. Over a year, this amounts to billions in reduced supply. If demand remains positive, this structural shift should continue supporting prices. Additionally, the data from previous cycles, while diminishing in magnitude, still shows a consistent pattern of post-halving appreciation.
The case against: Several structural changes have fundamentally altered the market dynamics that made the 4-year cycle reliable.
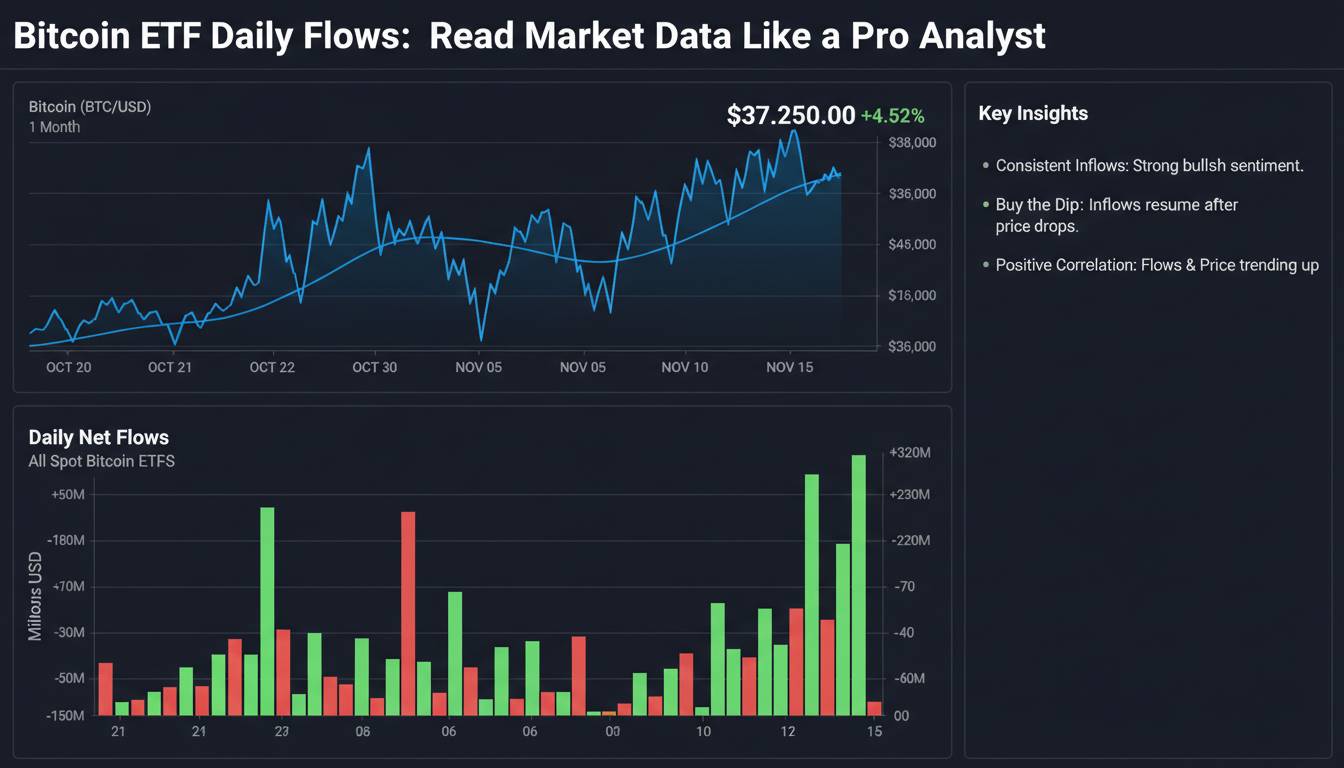
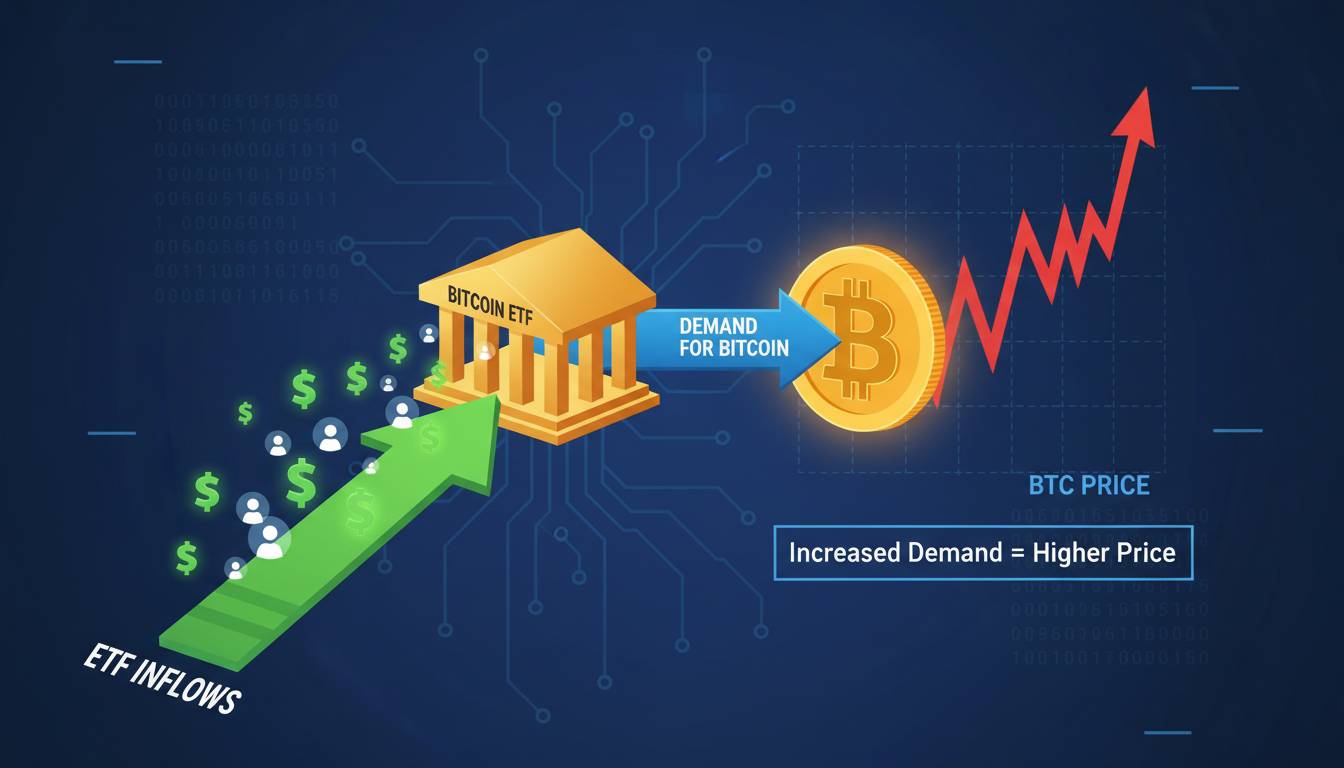
First, institutional participation has transformed Bitcoin from a speculative asset into an allocatable portfolio component. BlackRock’s Bitcoin ETF alone has attracted tens of billions in assets since approval in early 2024. These institutional flows don’t follow the same cyclical patterns as retail speculation—they’re driven by strategic asset allocation models that rebalance quarterly or annually, largely independent of the halving schedule.
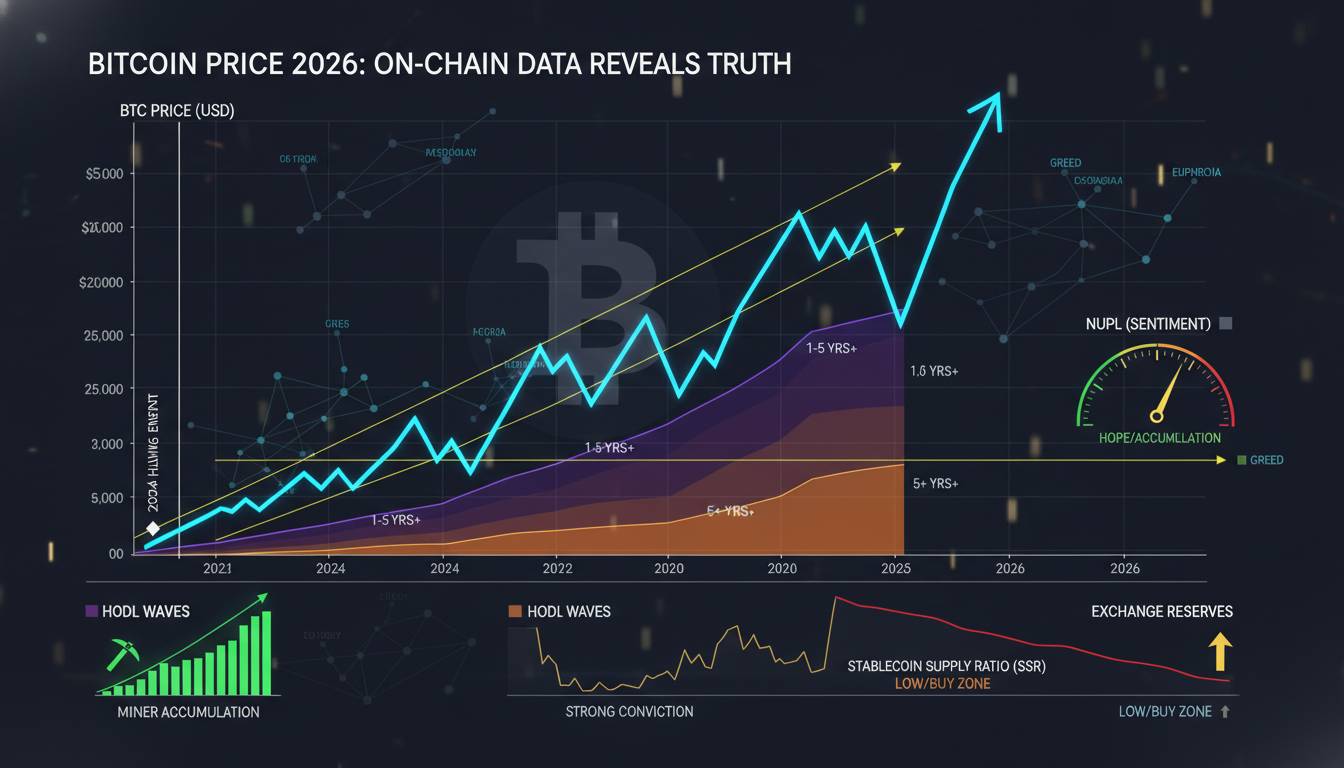
Second, the market is now dominated by holders with extremely long time horizons. Glassnode data consistently shows that over 70% of Bitcoin supply hasn’t moved in over a year. This means the “liquid” supply available for trading is a small fraction of total coins, and this supply is concentrated in sophisticated hands who understand the cyclical dynamics. They’re not selling during the periods when retail buyers are most enthusiastic.
Third, the halving itself has become a non-event in terms of market surprise. Every participant knows exactly when it will occur and has already positioned accordingly. The price action around the April 2024 halving was remarkably muted compared to previous cycles—Bitcoin didn’t crash, didn’t surge, it simply continued its existing trajectory. This suggests the market had fully priced in the event months earlier.
My honest assessment: the fundamental supply-side mechanics still exist, but the market’s reaction to those mechanics has evolved. The 4-year cycle isn’t dead, but it’s no longer the dominant force it once was. The 2024-2025 markup phase appears to be occurring, but it’s being driven by factors beyond the halving—primarily ETF inflows and institutional adoption—rather than the pure supply shock narrative that characterized earlier cycles.
What Could Break the Cycle Entirely
For the 4-year cycle to truly break, something would need to fundamentally alter either Bitcoin’s monetary policy or the market structure that has supported previous cycles.
Regulatory reversal represents the most significant tail risk. If a major economy—particularly the United States—were to dramatically restrict Bitcoin ownership or mining, it could disrupt the global market structure that has developed. The January 2025 SEC leadership change suggests a more favorable regulatory environment, but this could shift with future administrations.
Technology displacement is another possibility. If a competing cryptocurrency or technological innovation were to fundamentally challenge Bitcoin’s position as the dominant digital store of value, the cycle assumptions would need significant revision. While competitors exist, none have demonstrated the network effect, security, or institutional adoption that Bitcoin has accumulated over 16 years.
Market maturation itself could break the cycle. As Bitcoin becomes a fully mainstream asset class with mature derivatives markets and sophisticated participants, the volatility that enables dramatic cycle swings may continue declining. Lower volatility means smaller percentage moves in both directions, potentially rendering the dramatic bull-bear cycle pattern obsolete.
I’m skeptical any of these scenarios will play out dramatically in 2026 specifically. Regulatory changes tend to be gradual, not sudden. Technology displacement takes years, not months. And market maturation is an ongoing process rather than a discrete event. What I expect is continued evolution rather than sudden disruption—the cycle weakening gradually rather than breaking all at once.
Expert Perspectives and Market Sentiment
The conversation among professional analysts has shifted notably since the 2024 halving. Where previous cycles were dominated by technical analysts extrapolating historical patterns, current analysis places greater weight on macroeconomic factors and institutional flows.
On the bullish side, analysts at firms like Bernstein have pointed to the structural demand from ETF inflows as fundamentally different from previous cycles where demand was primarily speculative. If ETFs continue absorbing Bitcoin at current rates—while supply from mining continues declining—the supply-demand dynamic becomes unambiguously bullish regardless of cycle timing.
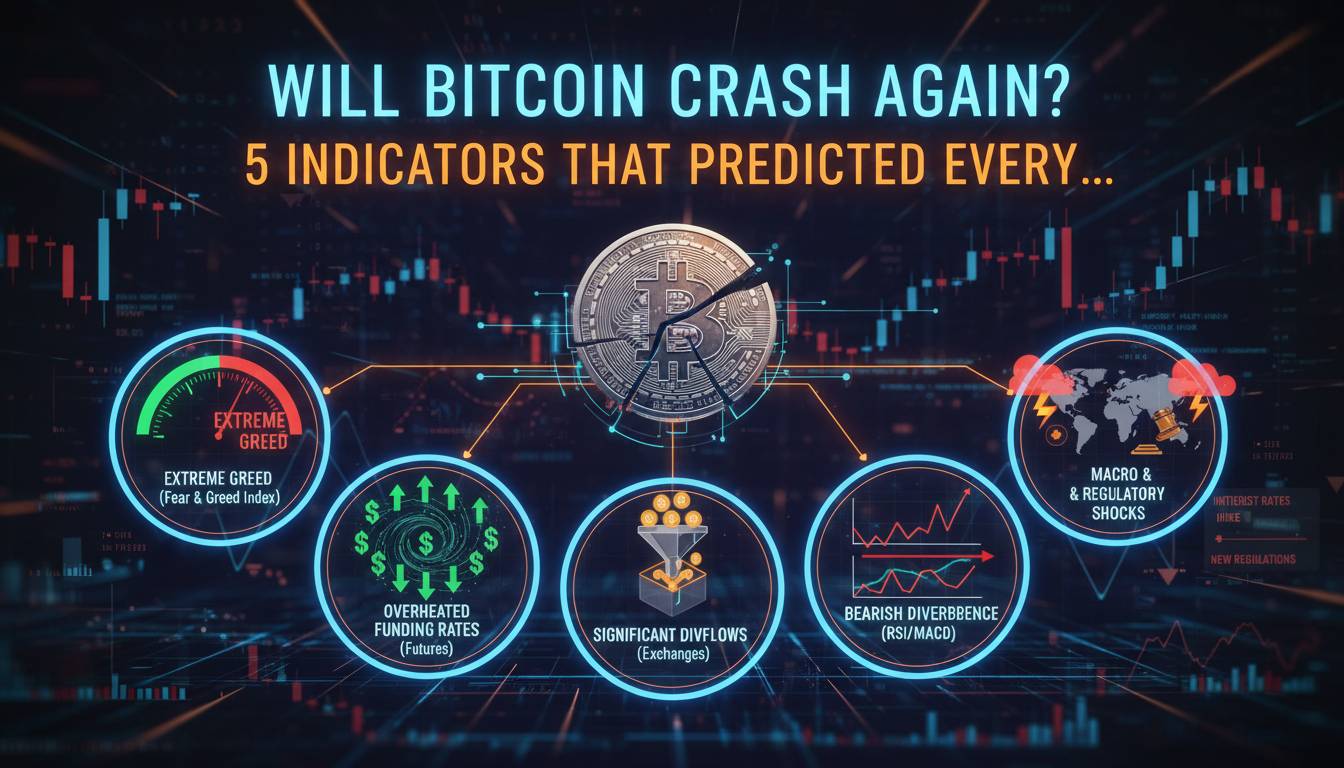
On the bearish side, analysts at CryptoQuant have highlighted concerning metrics including declining realized cap growth and increasing exchange reserves, suggesting distribution may be underway despite nominal price appreciation. These on-chain signals have historically preceded major corrections.
What strikes me as most reasonable is a middle ground: the cycle still exists but its amplitude has changed. We’re unlikely to see another 10x or 17x cycle from current levels—not because Bitcoin can’t appreciate, but because the base is now too large. Instead, cycles may manifest as 3-5x moves over longer timeframes, with each cycle peak still exceeding the previous one but with diminishing returns.
For 2026 specifically, I expect continued strength if current dynamics persist, but with increasing volatility as the market digests enormous gains from 2024-2025. The halving effect has already been substantially realized in current prices. What drives 2026 will be broader factors: macroeconomic conditions, regulatory developments, and the pace of institutional adoption.
Conclusion
The Bitcoin 4-year cycle isn’t a law of nature—it’s an emergent pattern from a specific monetary policy interacting with market psychology over time. That pattern still exists, but it now operates alongside forces that didn’t exist during previous cycles: institutional capital, regulated ETFs, sophisticated derivatives markets, and globally interconnected trading.
If you’re trying to time your investments based on the halving cycle alone, you’re working with an incomplete framework. The cycle provides useful structural context—understanding where we might be in the broader market structure—but it’s not a crystal ball. The April 2024 halving did create genuine supply-side pressure, and that pressure is contributing to current price levels. But the dramatic price appreciation that followed wasn’t caused by the halving in any simple sense; it was driven by ETF inflows and the broader institutionalization of Bitcoin.
What I tell people is this: Bitcoin remains a compelling asset class with structural advantages that no other cryptocurrency has replicated. But approach cycle timing with appropriate humility. The market that will exist in 2026 will have dynamics we can’t fully predict from where we sit today. The 4-year cycle is still worth understanding—it’s just no longer sufficient for making investment decisions on its own.