Most traders approach the descending triangle all wrong. They see the pattern, draw their trendlines, and commit capital without ever checking whether volume confirms what the price is trying to do. That’s a critical oversight—one that costs them money consistently.
The descending triangle is a recognizable continuation pattern in technical analysis, but it fails more often than retail traders realize. Adding volume analysis to your toolkit changes how you see the entire pattern. What looks like a textbook setup can unravel the moment you overlay volume data and realize the buying pressure has been evaporating for weeks.
This guide covers how to combine the descending triangle pattern with volume confirmation to filter out weak setups and enter trades with real edge. You’ll learn what separates a tradable descending triangle from one that’s destined to fail, which volume indicators add value versus those that create noise, and the specific criteria I use to determine whether a breakout is legitimate before I risk a single dollar.
Understanding the Descending Triangle Pattern
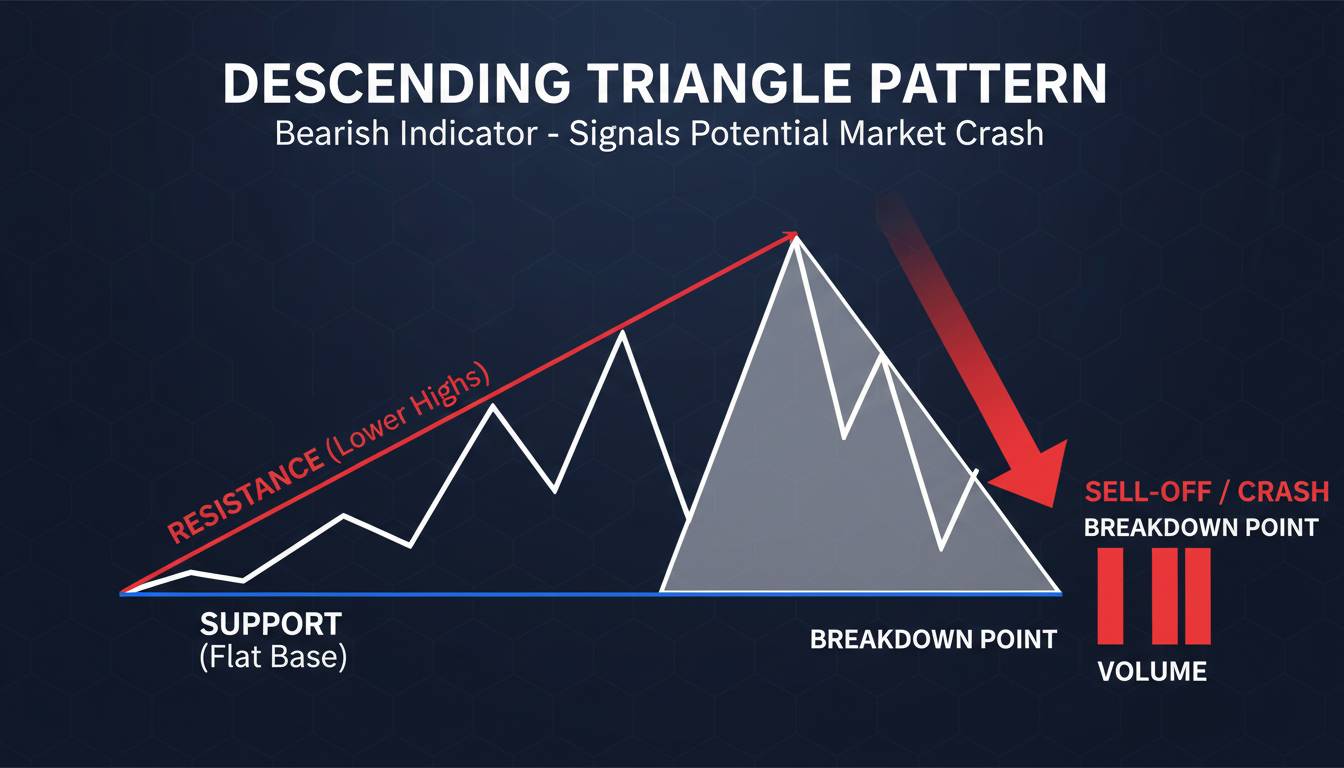
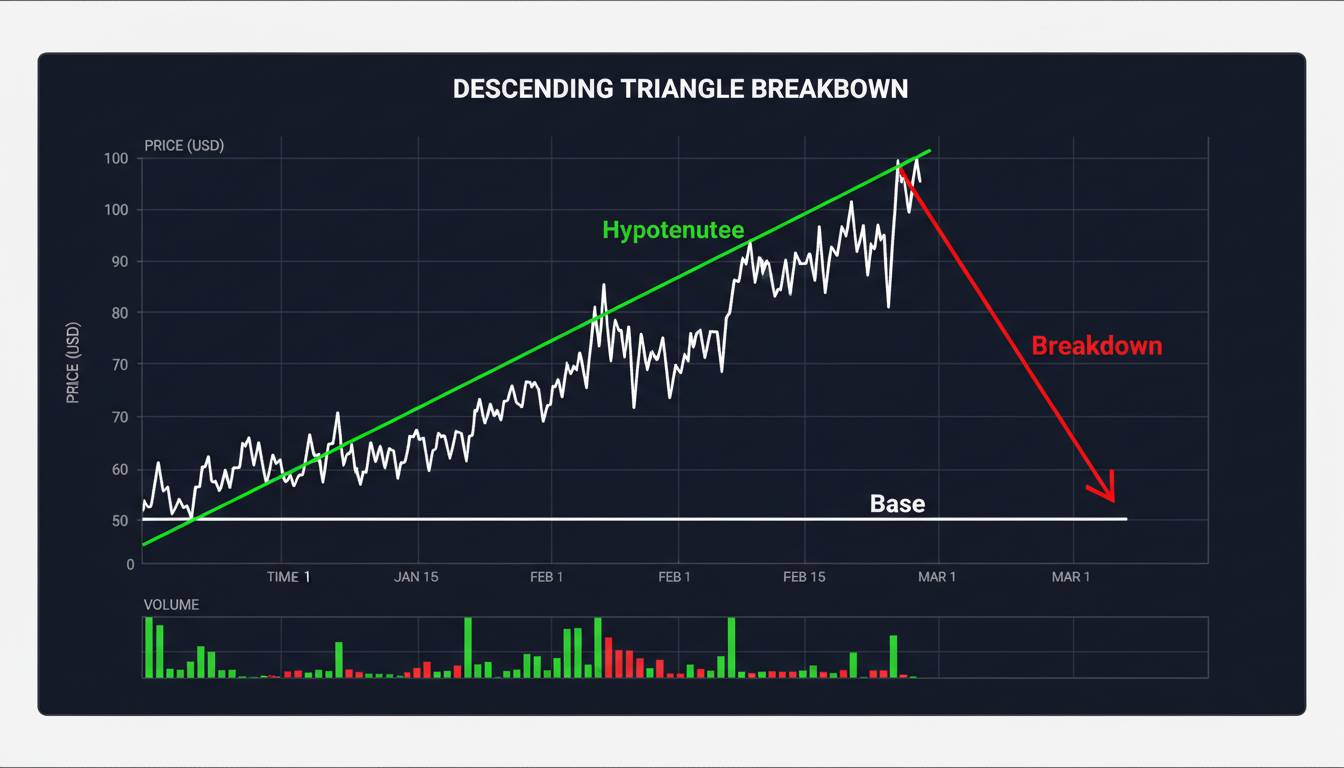
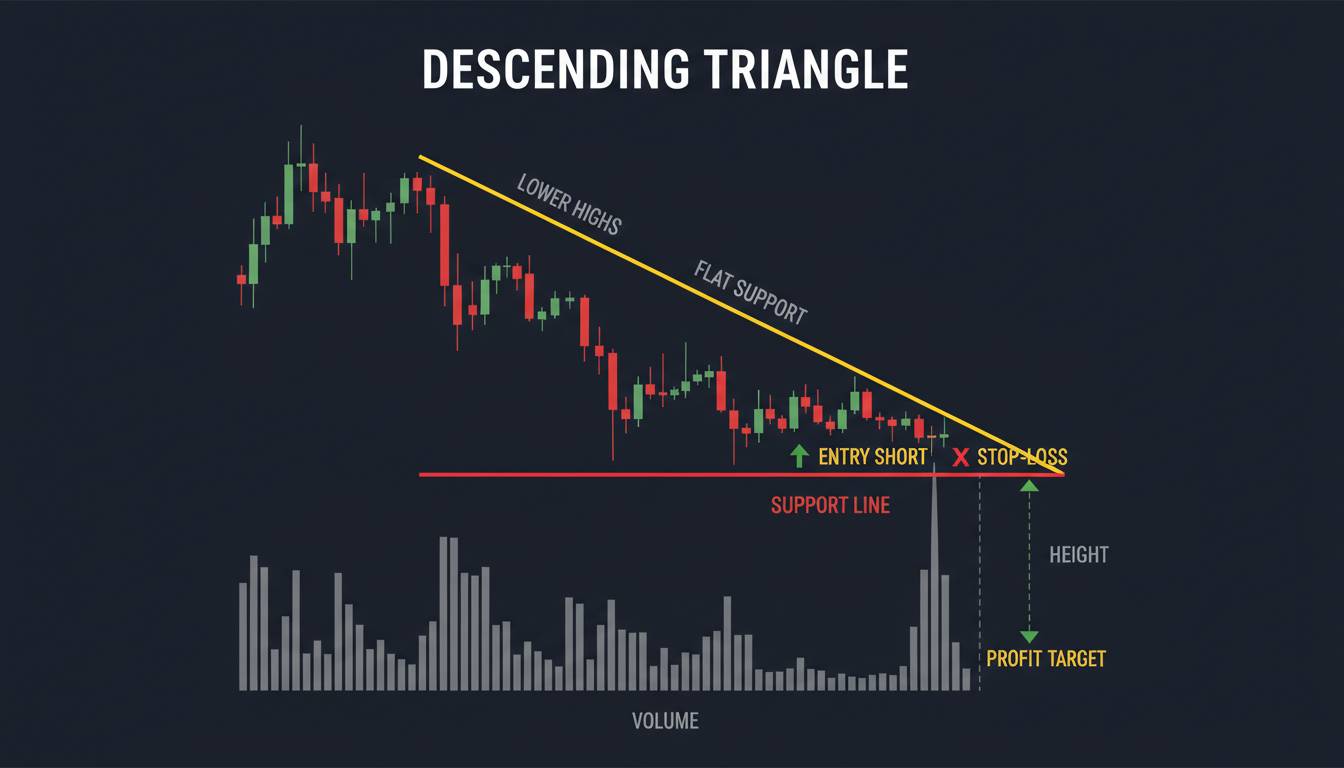
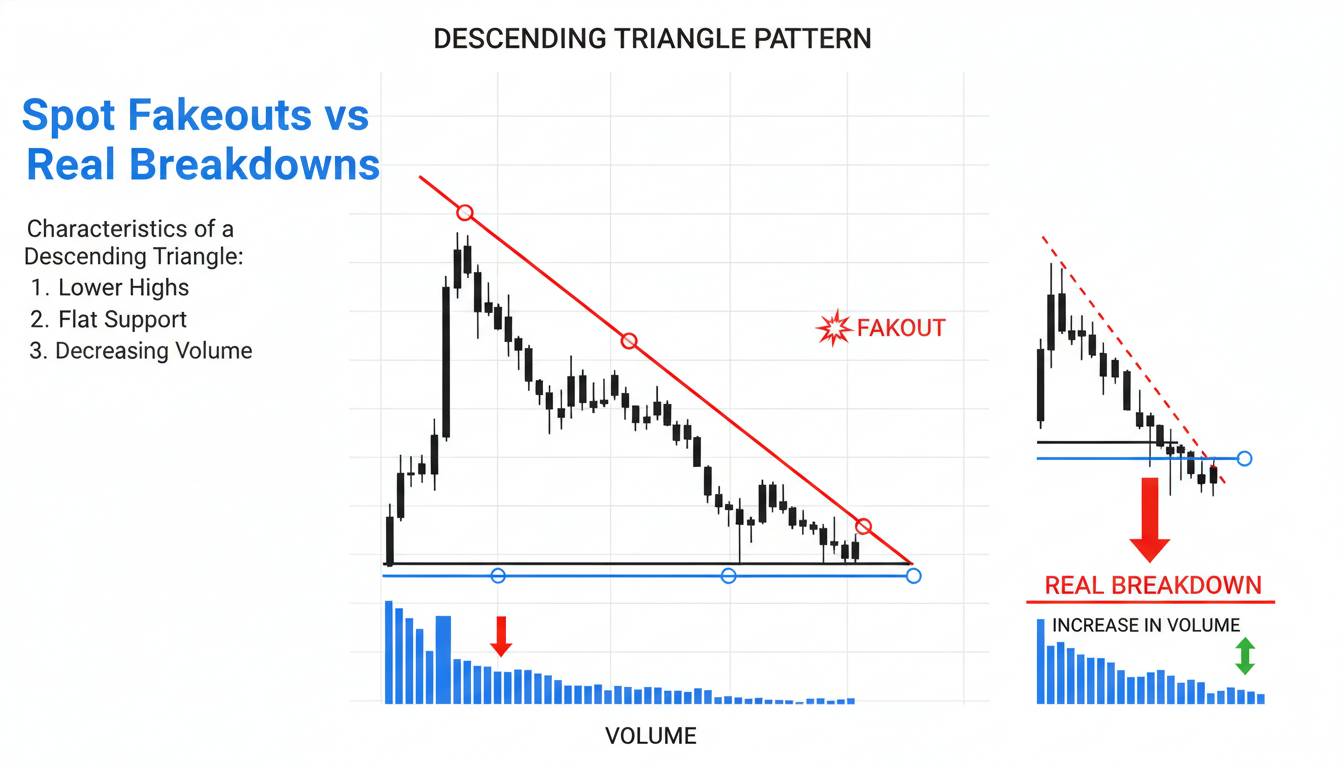
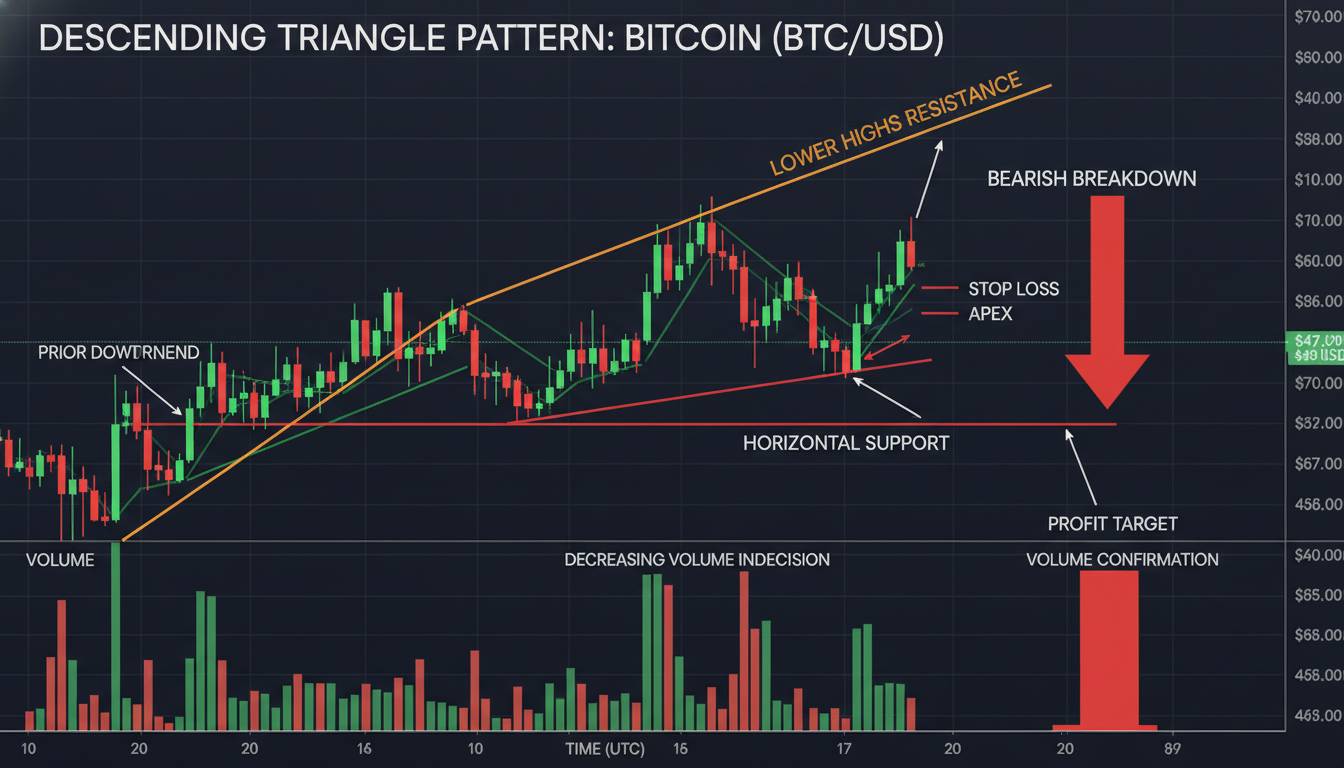
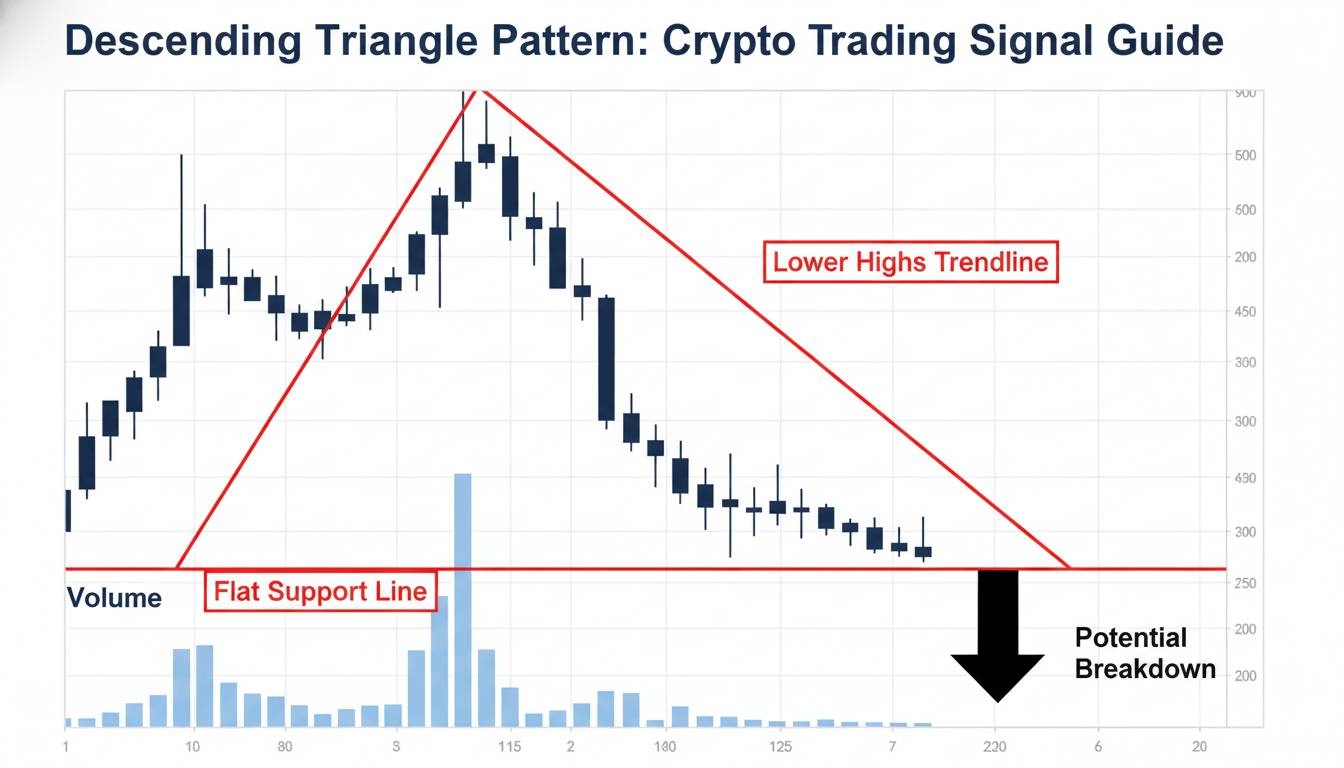
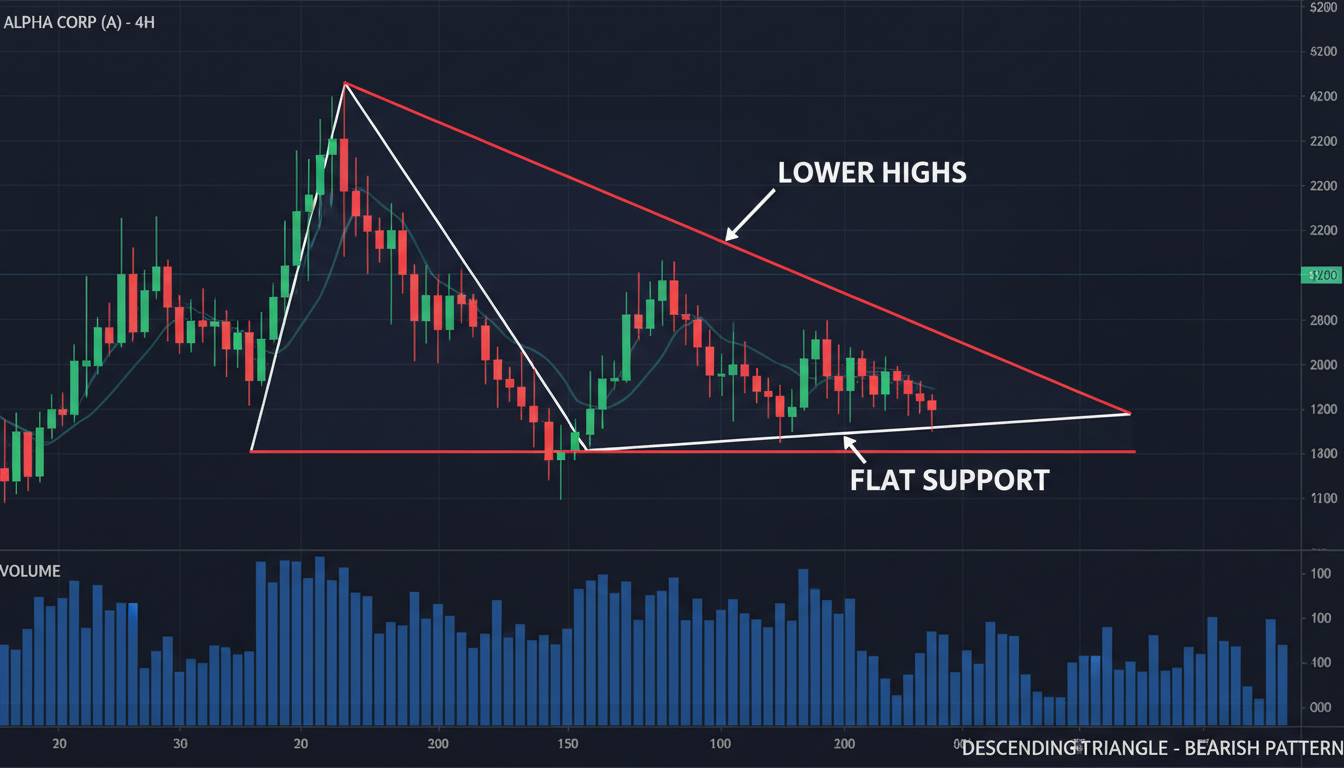
The descending triangle is a bearish continuation pattern that forms when price creates lower highs while holding steady at a horizontal support level. The support line draws across the swing lows, and the declining resistance line connects the lower highs. This creates a contracting range that typically resolves downward—but here’s what most traders miss: the pattern’s bearish bias only becomes valid after a confirmed breakout below the support level. Until then, you’re looking at a potential reversal setup.
Welles Wilder, the creator of RSI and ADX, emphasized that patterns require confirmation before action. The descending triangle illustrates this perfectly. Price can hover at support for weeks, tempting traders to short the “obvious” breakdown, only to see it snap back upward in a violent reversal. The horizontal support line attracts bargain hunters who keep buying at the floor, and when enough buying pressure accumulates, the entire bearish narrative collapses.
Key characteristics of a valid descending triangle include at least two failed tests of the support level (creating a clean horizontal line) and at least two lower highs that demonstrate sellers are progressively more aggressive. The pattern typically forms over 2-6 weeks, though longer consolidations aren’t uncommon. The measured move target comes from projecting the pattern’s height downward from the breakout point—a rough expectation, but one that helps with risk management.
Why Volume Analysis Separates Winners From Losers
Volume tells you what price cannot: the actual conviction behind each move. A descending triangle that forms on declining volume suggests selling pressure is waning, which increases the probability of an upward reversal. Conversely, a pattern with expanding volume on the approach to support indicates genuine selling pressure building—making a breakdown more likely.
Consider what happens in a typical descending triangle formation. Price makes its first swing low and begins consolidating. Volume during this consolidation should contract relative to the preceding move—that’s the market absorbing supply. As price creates lower highs, each decline should come on lighter volume than the previous one if sellers are truly losing conviction. When the final breakdown occurs, you want to see expansion—a surge in volume as price breaks below support confirms that the supply/demand balance has finally tipped.
Robert Edwards and John Magee’s “Technical Analysis of Stock Trends” established volume as a validating force for pattern formation. More recently, Tom Bulkowski has backtested triangle patterns extensively, finding that volume characteristics significantly impact success rates. In his research, descending triangles with expanding volume on the breakdown showed considerably better performance than those with contracting volume—a finding that aligns with basic market mechanics but contradicts how most traders actually execute.
Combining Descending Triangle With Volume: The Practical Framework
The integration of volume analysis into descending triangle trading isn’t complicated, but it requires discipline. I evaluate three distinct phases: the formation, the breakout attempt, and the confirmation. Each phase has specific volume criteria that determine whether the pattern deserves your capital.
During formation, I want to see declining volume as the pattern develops. Each minor decline within the triangle should generate less selling pressure than the previous one. The horizontal support should attract buying interest—this shows up as elevated volume on the bounces—but that buying should progressively weaken. If volume remains elevated during the entire formation, the pattern is less reliable because conviction hasn’t narrowed.
The approach to support matters enormously. Watch for a subtle increase in volume on the final approach to the support line. This often indicates one last surge of selling before either the breakdown occurs or a reversal materializes. Many failed breakdowns happen precisely because this final volume surge doesn’t appear—selling pressure has already been spent, and the market simply drifts through support on minimal volume before reversing.
The breakout itself requires expanding volume. A breakdown below support on declining volume is suspect—it suggests lack of conviction and increases the probability of a false breakout. The strongest setups show a clean break on volume that exceeds the average of the previous 20 days by a meaningful margin.
The Volume Confirmation Checklist Before Entering a Trade
Before I enter any descending triangle trade, I run through a specific checklist. Skip any of these and I’m significantly reducing my edge.
First, confirm that volume has been declining during the triangle’s formation—specifically, each minor decline should generate less volume than the previous decline. Second, verify that the final approach to support shows either contracting volume or a final surge that then breaks. Third, require expanding volume on the actual breakdown—breakouts below support on declining volume are where most traders get crushed. Fourth, check whether volume has been expanding on bounces off support during formation; if buying pressure is actually increasing rather than weakening, the bearish thesis weakens considerably.
This checklist filters out perhaps 60-70% of descending triangles that appear on charts. That’s the point. The remaining setups carry substantially higher probability because volume has confirmed what price suggests.
Trading the Setup: Entry, Stop-Loss, and Position Sizing
The entry trigger matters less than most traders believe. I wait for a close below the support level on increased volume. This means price actually breaks and closes beneath the horizontal support—not just an intraday spike below it.
Stop-loss placement is where discipline often fails traders. My preference is to place the stop 1-2 ATR values above the support level, giving the trade room to breathe while protecting against catastrophic losses. Placing stops just below the breakout candle creates unnecessary whipsaws—markets often retest broken support before continuing downward, and tight stops get hunted.
Position sizing follows directly from your stop placement. If you’re risking 2% of capital per trade and your stop is 50 points away, your position size is predetermined by that math. This approach removes emotion from sizing decisions and ensures survivability through losing streaks.
Risk-reward expectations should be conservative. The measured move (pattern height projected downward) represents an optimistic target. More realistic outcomes see partial moves or require scaling out. I typically target 1.5:1 minimum, but I’m willing to take whatever the market gives after the trade works.
The Most Common Mistakes Traders Make
The single biggest mistake is trading the pattern without any volume analysis. I’ve watched traders with years of experience place short positions on every descending triangle they spot, never understanding why their win rate hovers around 40%. They see a bearish pattern and assume bearish action follows. The market doesn’t owe you anything based on pattern recognition alone.
Another critical error involves misreading volume on the breakdown. Traders often see volume increase and assume the breakout is confirmed—but context matters. Was the volume increase meaningful relative to recent history, or was it just slightly above average? The distinction determines whether you’re looking at a genuine breakdown or a last-gasp spike that reverses within days.
Failing to account for the broader trend is subtler but equally damaging. A descending triangle in a strong uptrend might resolve downward, but the prevailing trend often reasserts itself. Volume analysis helps here too: if the overall trend is up but you’re seeing a descending triangle form with weakening volume on the declines, the probability of an upward break increases significantly.
A Contrarian View: When Descending Triangles Actually Break Higher
Here’s what conventional wisdom gets wrong: descending triangles don’t always break down, and the volume analysis most traders use is incomplete. I’ve seen countless setups where volume contracted throughout the pattern, suggesting weakening selling pressure, and then price broke above the declining resistance line in a clean reversal. The pattern looked bearish on the charts but was actually distributing from earlier buyers.
Tom Bulkowski’s research on triangle patterns found that roughly 64% of descending triangles break to the downside—but that means 36% break higher. Volume analysis can help identify which category a specific pattern likely falls into. When buying volume during bounces off support remains strong relative to selling volume during declines, the pattern’s bearish bias decreases substantially.
This doesn’t mean you should start buying every descending triangle. It means you should hold your bearish conviction loosely until volume confirms the direction. The traders who make money in this market are the ones who adapt to what the volume tells them rather than insisting that patterns must resolve according to textbook definitions.
Practical Example: Applying the Framework
Let me walk through how this works in practice. Imagine a stock forming a descending triangle over three weeks. The first decline came on elevated volume, the second on lighter volume, and the third on even lighter volume. The bounces off support show moderate volume but no expansion—buyers are present but not aggressive. This pattern of contracting volume suggests the selling pressure is exhausting.
Now the final approach to support begins. Volume starts picking up slightly—not dramatically, but enough to notice. Then the breakdown occurs: price breaks below the horizontal support on the highest volume in three weeks. The close is below support. This meets every criterion on the checklist.
Compare this to a descending triangle where volume has been elevated throughout the formation, bouncing off support on heavy volume each time, and the breakdown occurs on average volume. The first scenario has genuine breakdown momentum. The second has a pattern that looks right but lacks confirmation.
The difference in outcomes is stark. The first setup breaks to the measured move and beyond. The second sees price spike below support, hit the stops, and then reverse sharply—leaving short-sellers bleeding while the market continues higher.
Conclusion: Volume Is Your Edge
The descending triangle is a common pattern—which means it’s heavily traded by both retail and institutional participants. The traders who consistently profit from this pattern aren’t smarter than everyone else. They simply have a filter that most traders lack: they wait for volume to confirm what price suggests.
You now have a framework for evaluating descending triangles that goes far beyond pattern recognition. The checklist, the phase-by-phase volume analysis, and the understanding of when the bearish thesis weakens—these tools take minutes to apply and can meaningfully improve your trading results.
But I want to be honest about something: even with perfect volume confirmation, you’ll still lose trades. No pattern or indicator combination produces 100% success. What volume analysis does is improve your probability distribution—shifting your outcomes from random to tilted in your favor. Over hundreds of trades, that tilt compounds into meaningful capital growth.
The next time you spot a descending triangle on any chart, don’t act until you’ve checked the volume. The market will always present opportunities. Your job is to wait for the ones that confirm themselves. That’s where the edge lives.