If you think ETF inflows simply buy Bitcoin and push prices up, you’re missing the actual mechanism that makes this market move. The relationship between Bitcoin ETF flows and price action is more nuanced than most analysts admit — and understanding the real mechanics is the difference between reading headlines and understanding what’s actually happening beneath them.
Since the January 2024 SEC approval of spot Bitcoin ETFs, these products have fundamentally altered how institutional and retail capital enters the Bitcoin market. But the way those flows translate into price movement involves a chain of events that most articles on this topic never bother to explain. I’m going to walk through exactly how that works — both when money flows in and when it flows out — because the mechanics reveal why ETF flows can move prices far more dramatically than their raw dollar volume would suggest.
What Are Bitcoin ETF Flows and Why Do They Matter
ETF flows represent the net amount of money entering or exiting spot Bitcoin ETFs on a given trading day. When investors buy shares of a spot Bitcoin ETF, the ETF issuer is obligated to purchase actual Bitcoin in equivalent value — this is the creation/redemption mechanism that keeps ETF share prices aligned with net asset value. Conversely, when investors sell ETF shares, the issuer redeems those shares and sells Bitcoin on the open market.
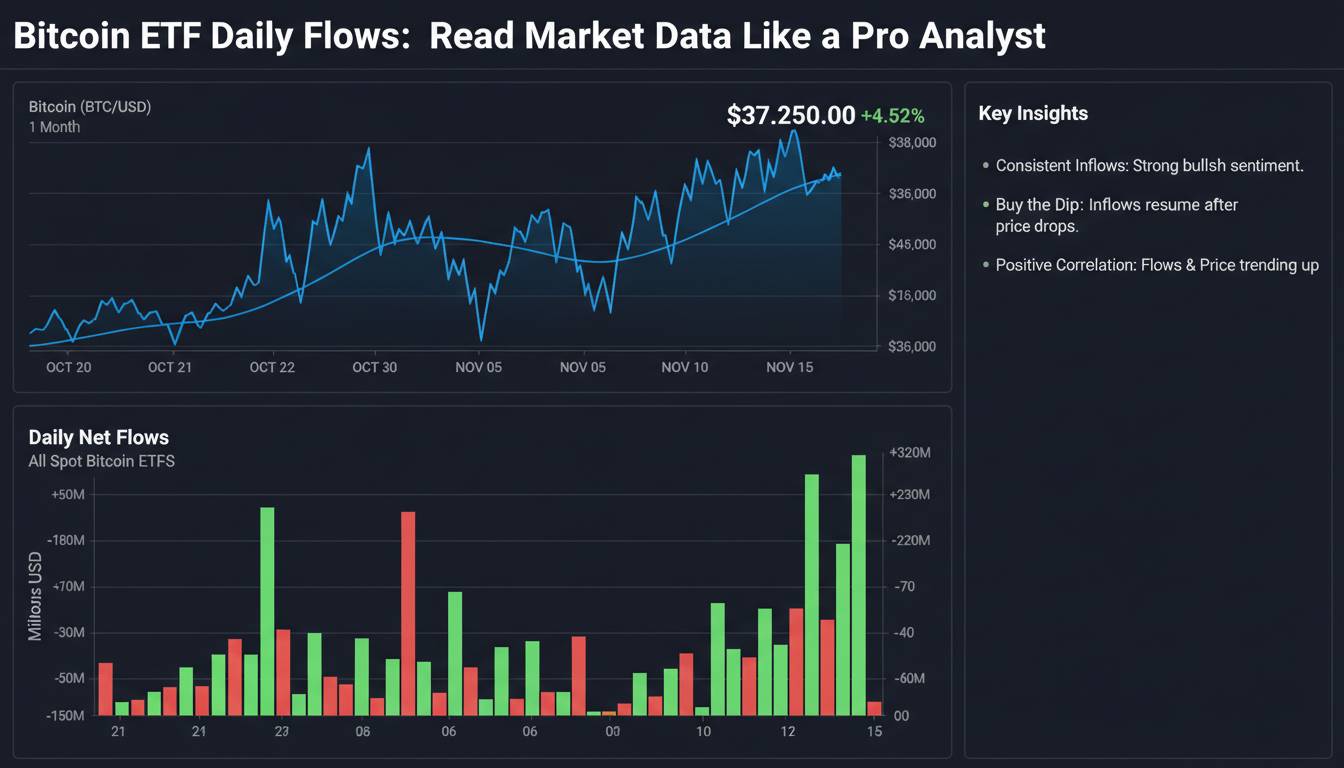
This sounds straightforward, but here’s the catch: the daily flow numbers reported by sources like Bloomberg and CoinDesk represent the net flow after all creation and redemption activity settles. A single day might see $500 million in creation activity and $300 million in redemptions, resulting in a reported net inflow of $200 million. The market, however, reacts to the gross activity, not just the net number.
Why should you care? Because ETF flows have become the single largest driver of Bitcoin’s price discovery during US market hours. Before spot ETFs existed, Bitcoin trading was dominated by crypto-native exchanges with relatively limited institutional participation. Now, billions of dollars in daily flow through products like BlackRock’s IBIT, Fidelity’s FBTC, and Grayscale’s GBTC create buying or selling pressure that moves the entire global Bitcoin market — even though these ETFs only trade during US market hours.
The significance extends beyond just the direct Bitcoin purchases. ETF flows serve as a real-time sentiment indicator that algorithmic traders, derivatives markets, and macro investors all watch closely. When IBIT sees $500 million in inflows on a Tuesday, that signal propagates through the entire Bitcoin ecosystem within minutes.
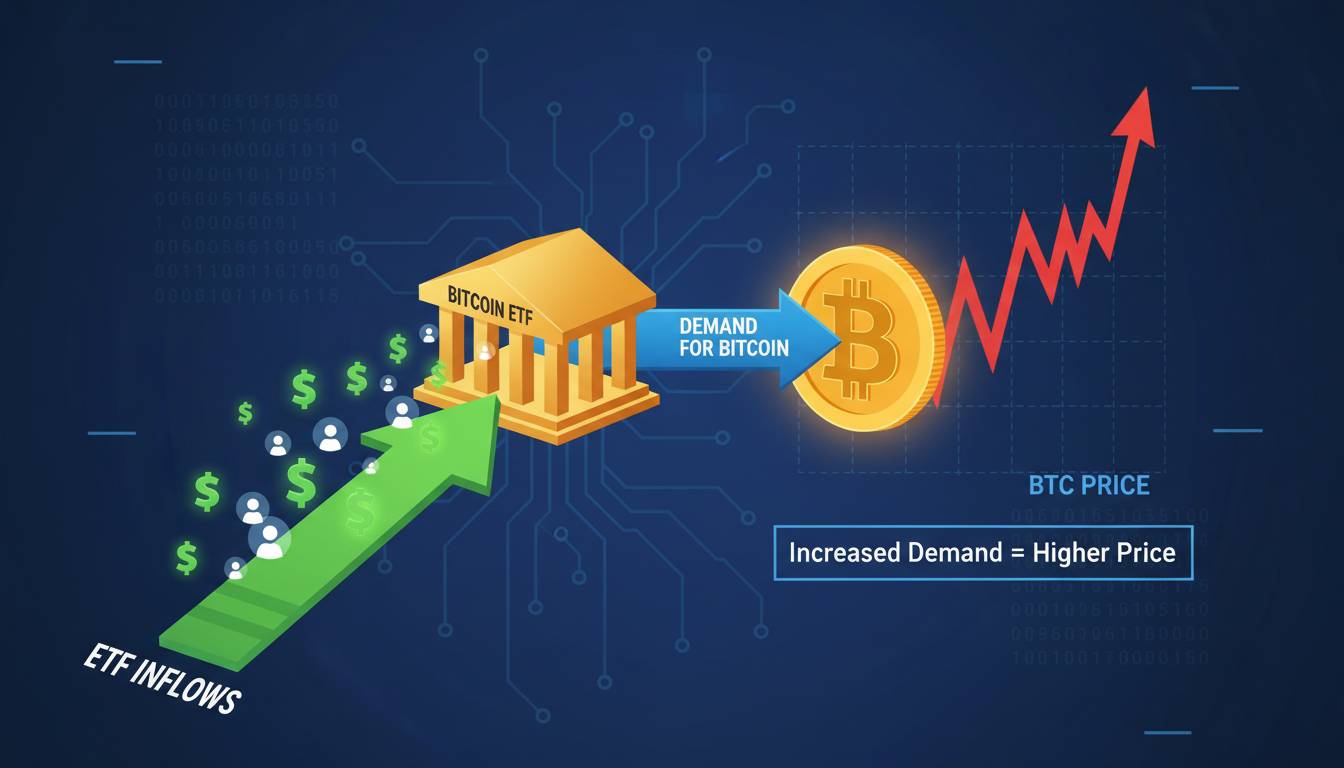
How Bitcoin ETF Inflows Move Prices Higher
The mechanism through which ETF inflows push prices higher involves three distinct phases that amplify the initial impact far beyond what the raw dollar amount would suggest.
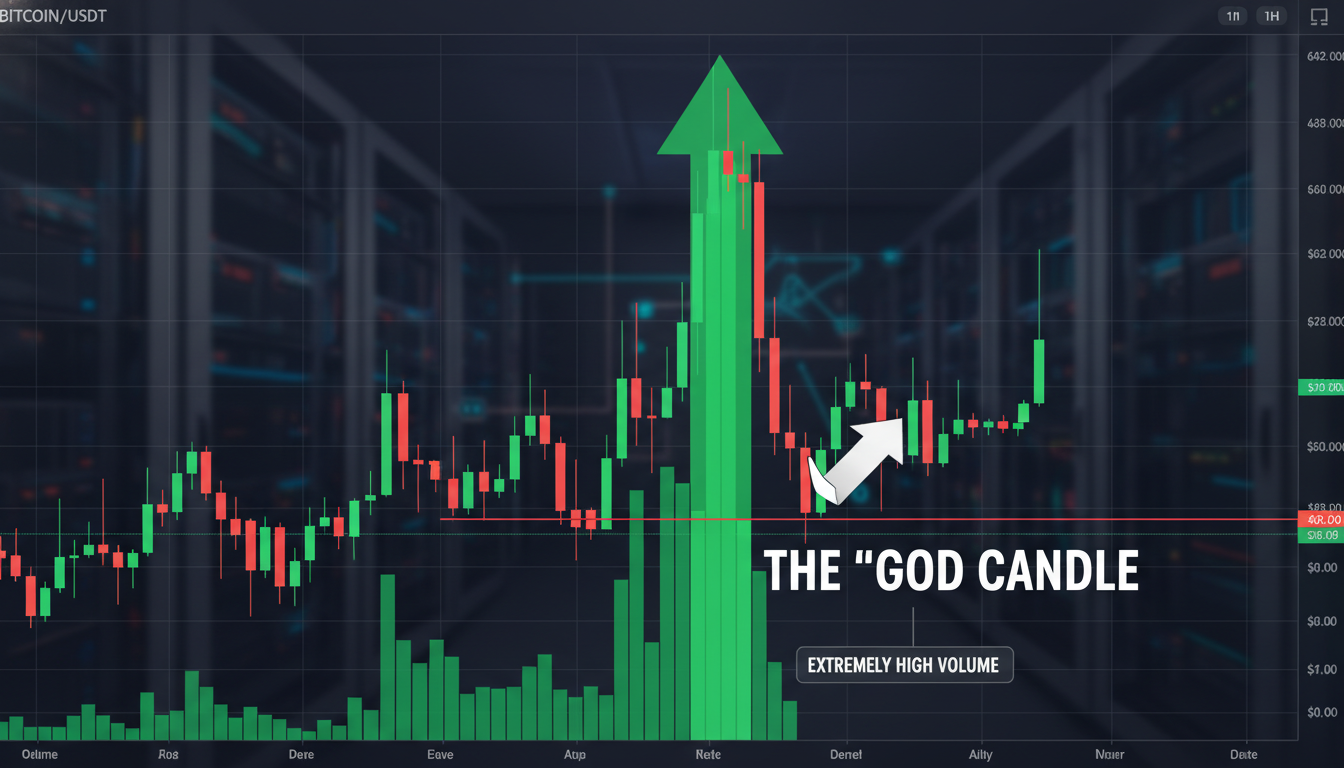
Phase one is direct market buying. When an ETF receives a creation order — meaning an authorized participant has deposited cash and the ETF must buy Bitcoin to issue new shares — that buying occurs on crypto exchanges. If the flow is large enough, it immediately lifts the spot price because there’s a finite amount of Bitcoin available at any given price level. This is basic supply and demand, and it’s where the common explanation usually stops. But this is only the beginning.
Phase two is derivatives market amplification. This is where the real price action happens. When spot Bitcoin ETF purchases begin pushing the spot price higher, futures markets — particularly the CME Bitcoin futures — react almost immediately. The price gap between spot and futures widens, which triggers arbitrage desks to buy spot and sell futures simultaneously. This arbitrage activity creates additional demand for spot Bitcoin, pushing prices even higher. Meanwhile, options markets see increased buying of call options as traders position for continued upside. Market makers who sold those calls must delta-hedge by purchasing more Bitcoin, creating another layer of buying pressure.
Phase three is momentum and sentiment feedback. Once prices begin rising, systematic buyers enter the market. Trend-following algorithms across quant funds increase exposure as momentum turns positive. Retail traders see the price action and FOMO kicks in. The initial ETF flow has now triggered a self-reinforcing buying cycle that can continue well after the original flow settles.
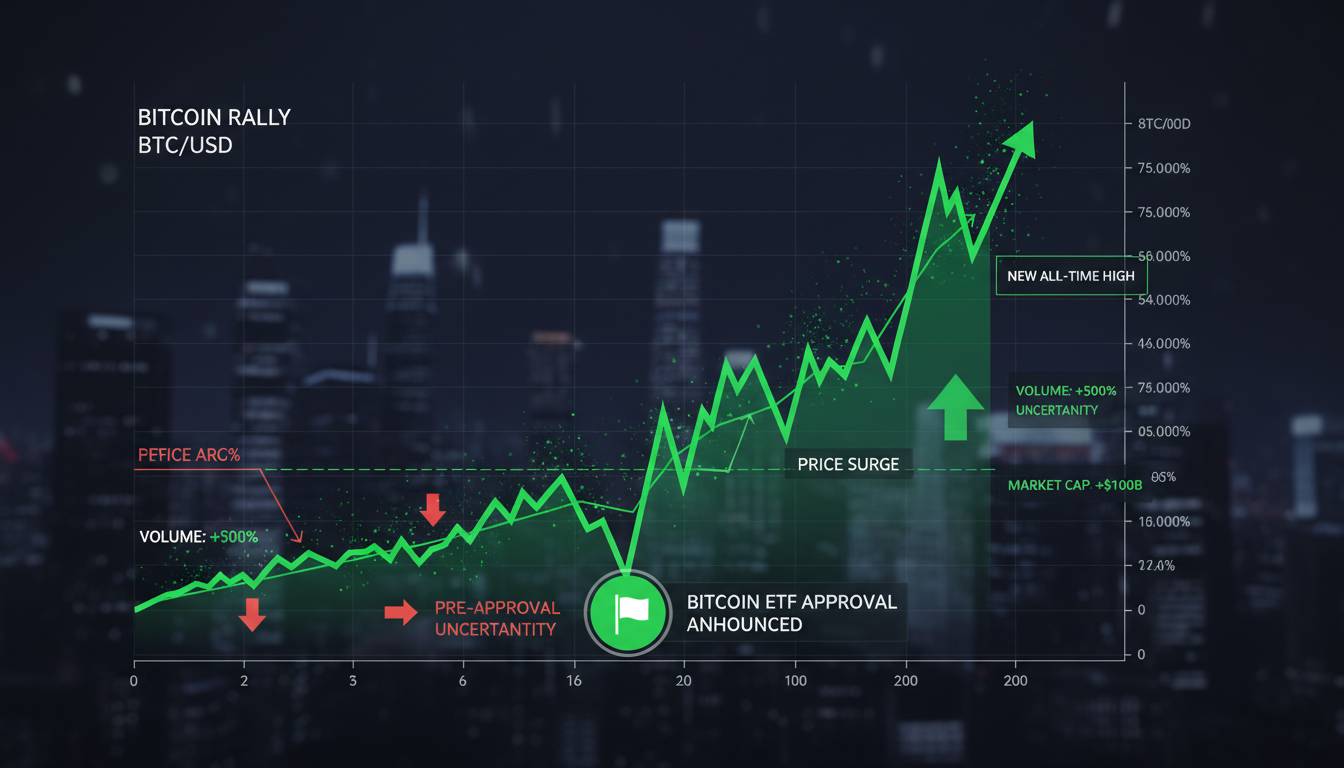
A concrete example: on March 12, 2024, IBIT recorded a single-day inflow of approximately $1.1 billion — one of the largest single-day inflows in ETF history. Bitcoin’s price jumped roughly 5% that day, from around $67,000 to above $71,000. But the move didn’t stop there. Over the following week, as the market digested the implications of that massive inflow and the derivatives mechanics kicked in, Bitcoin continued climbing to new all-time highs above $73,000. The initial $1.1 billion directly moved prices, but the cascade it triggered extended the rally significantly further.
This is why I tell people to watch ETF flows not just as a number, but as a signal. The raw flow matters, but what matters more is how the market absorbs that flow and what derivatives positioning looks like at that moment.
How Bitcoin ETF Outflows Push Prices Lower
If inflows create a multi-phase amplification effect, outflows work through a roughly similar but inverted mechanism — and in my experience, outflows tend to hit harder and faster than equivalent inflows. There are structural reasons for this asymmetry that most analysts overlook.
When investors redeem ETF shares, the issuer must sell Bitcoin to generate cash for the redemption. This spot selling pressure hits immediately, but the market doesn’t simply absorb it and move on. Instead, the psychological impact of outflows triggers additional selling across the broader market.
Consider what happened in late April and early May 2024. After a period of sustained inflows that pushed Bitcoin above $70,000, the market began seeing consecutive days of outflows from GBTC in particular — which had converted from a closed-end fund to an ETF and faced significant redemption pressure from early investors looking to lock in profits. On May 1, 2024, total Bitcoin ETF outflows hit approximately $288 million. Bitcoin’s price dropped from around $63,000 to below $57,000 over the following week.
The interesting part: the outflows themselves weren’t large enough to explain the full magnitude of the move. What happened was a classic case of sentiment compounding. As outflows persisted, systematic sellers — including risk-parity funds and volatility-targeting strategies — began reducing exposure. Futures funding rates turned negative, indicating shorts were dominant. Options market positioning shifted bearish. Each layer of the market reinforced the others, turning what started as direct selling pressure into a more significant correction.
There’s also a structural asymmetry worth understanding. Outflows tend to be more concentrated in time. When investors decide to exit Bitcoin positions, they often do so relatively quickly and simultaneously — particularly institutional investors managing downside risk. Inflows, by contrast, tend to be more gradual and staggered as capital deploys over time. This means that a $300 million outflow day often creates more acute price impact than a $300 million inflow day.
One more thing: the ETF outflow story isn’t just about the direct selling. It’s about what outflows signal to the rest of the market. Every outflow day reinforces the narrative that demand is weakening, which attracts additional sellers who were waiting for exactly that signal. This is why tracking the streak of outflow days matters far more than any single day’s number. Three consecutive outflow days tell you something fundamentally different from one isolated outflow amid a pattern of inflows.
The Size of ETF Flows Compared to Total Bitcoin Market
Here’s a number that surprises most people: daily Bitcoin trading volume typically exceeds $30 billion globally. The largest single-day ETF inflow on record — around $1.1 billion — represents roughly 3.5% of daily global Bitcoin trading volume. That seems too small to move a market, doesn’t it?
It would be, if Bitcoin’s liquidity were evenly distributed across all price levels and all trading hours. But it isn’t. The reality is that Bitcoin’s order book becomes increasingly thin as you move away from the current spot price. To move Bitcoin’s price significantly, you don’t need to buy or sell more volume than the total market — you need to exhaust the liquidity available at the current price level.
ETF flows create concentrated impact for several reasons. First, they trade during US market hours, when liquidity on crypto exchanges is often thinner than during Asian trading sessions. Second, ETF buying or selling tends to hit specific price levels as it interacts with the order book, rather than being spread evenly across a range. Third, and most importantly, ETF flows are not the only thing reacting to themselves — the entire market watches them and positions accordingly.
Think of it this way: if a single large institutional investor moves $100 million into Bitcoin through an ETF, that’s direct buying pressure. But simultaneously, hundreds of algorithmic trading systems detect that $100 million inflow and adjust their positioning. Options market makers delta-hedge. Trend followers increase exposure. Arbitrage desks move spot-futures basis. The original $100 million has now triggered a cascade of additional buying that might represent another $200-300 million in implied demand.
This is why I don’t particularly care when people argue that ETF flows are too small to matter for Bitcoin’s $1+ trillion market cap. The raw volume argument misses the point entirely. It’s not about the size of the flow relative to total market cap — it’s about the flow’s role as a catalyst and signal that amplifies far beyond its initial dollar value.
What Actually Moves ETF Flows Themselves
Understanding how inflows and outflows move prices is valuable, but it only tells half the story. To anticipate where flows are heading, you need to understand what drives them in the first place — and this is where most analysis falls short.
ETF flows respond to several key drivers, and they don’t all point in the same direction at once.
Macro conditions and interest rates play a significant role. Bitcoin often competes with fixed-income assets for institutional allocation. When real yields are high, the opportunity cost of holding Bitcoin increases, which tends to suppress inflows. Conversely, when rate cut expectations increase and yields fall, Bitcoin becomes more attractive as a yield-bearing or growth asset. The flows since early 2024 correlate meaningfully with shifting Fed policy expectations.
Performance relative to other assets matters enormously. Institutional allocators evaluate Bitcoin against equities, bonds, and commodities on a regular rebalancing schedule. When Bitcoin outperforms — as it did dramatically in late 2023 and early 2024 — flows tend to accelerate as portfolio managers increase allocation to capture momentum. When it underperforms, as it did during the May 2024 correction, flows can reverse sharply as managers trim exposure.
Regulatory developments create sudden flow shifts. Positive regulatory news — such as the SEC approval in January 2024 — can trigger massive inflows as previously sidelined capital gains access. Negative developments, even just enforcement actions or political statements, can trigger outflows as risk-averse capital exits.
Technical factors and rebalancing schedules create predictable patterns. Many institutional allocators rebalance their Bitcoin exposure on monthly or quarterly schedules. This means flows tend to cluster around specific calendar dates regardless of price action. Understanding these cycles can give you an edge in anticipating flow direction.
Sentiment and narrative drive retail flows in particular. When Bitcoin is in the news for hitting new highs, retail inflows tend to accelerate. When coverage turns negative — focusing on crashes or regulatory crackdowns — retail flows can reverse. This is less predictable than institutional behavior but still observable through flow data.
The key insight here is that flows aren’t random. They respond to identifiable drivers, which means you can build a framework for anticipating them rather than simply reacting to yesterday’s numbers.
How to Monitor and Interpret ETF Flows Effectively
Raw flow numbers are only useful if you know how to interpret them. Here’s the practical part — how to actually use this information in your analysis.
Look at the trend, not just the daily number. A single day of outflows doesn’t mean the market is turning. What matters is the trajectory. Three consecutive outflow days signals something fundamentally different from an isolated outflow amid weeks of inflows. Track the rolling weekly and monthly totals, not just the daily headline.
Distinguish between ETF products. Not all ETF flows are created equal. IBIT and FBTC tend to see inflows from long-term holders adding to positions. GBTC, with its higher fee structure, has seen significant outflows as it shed its closed-end fund investor base. When analyzing flows, segment by product to understand who’s actually buying or selling.
Watch the context, not just the number. A $200 million inflow on a day when Bitcoin is already up 5% has different implications than the same inflow when Bitcoin is down 5%. The market’s positioning and sentiment at the moment of the flow matters as much as the flow itself. This is why I always look at price action concurrent with flow data.
Cross-reference with derivatives data. ETF flows make more sense when you understand how the derivatives market is positioned. Check CME futures open interest, funding rates, and options put-to-call ratios alongside flow data. If flows are positive but funding rates are deeply negative, that suggests the market isn’t convinced the upside will hold.
Use multiple data sources. Different providers sometimes report slightly different flow numbers due to timing and methodology differences. Cross-reference between Bloomberg, CoinDesk, and the ETF issuers themselves when precision matters. For day-to-day analysis, consistency across sources matters more than exact accuracy.
Conclusion
The relationship between ETF flows and Bitcoin prices isn’t as simple as “buying pushes prices up and selling pushes them down.” It’s a multi-phase process involving direct market impact, derivatives amplification, and sentiment feedback loops that can extend price moves far beyond what the initial flow would suggest.
What matters isn’t just watching today’s flow number — it’s understanding the mechanism behind how that flow translates into price action and recognizing the structural factors that determine whether a given flow creates outsized impact or gets absorbed quietly. The market has shifted fundamentally since spot ETFs arrived, and the traders who understand the actual mechanics have a meaningful edge over those who simply read the headline numbers.
The question now isn’t whether ETF flows move the market — they clearly do. The question is whether you’re paying attention to the right signals at the right time, or just reacting to yesterday’s news after the move has already happened.