Most traders believe descending triangles break to the downside more often than not. They’re wrong—or at least, they’re only half-right. The actual data tells a more complicated story, and believing the myth has cost traders money for decades.
The truth: descending triangles break down somewhere between 64% and 75% of the time, depending on which study you reference and how strictly you define the pattern. But that single number hides a dozen important nuances that determine whether the pattern works in your favor or wipes out your position. The breakdown rate changes dramatically based on market context, timeframe, volume confirmation, and whether the pattern forms in a bull market versus a bear market.
Let me walk you through what the data actually shows, why the numbers vary so much, and what you need to know before trading this pattern.
The Raw Numbers: What the Studies Actually Show
Thomas Bulkowski’s research in the Encyclopedia of Chart Patterns remains the most comprehensive statistical analysis of triangle patterns. His data, based on thousands of historical charts, puts the descending triangle breakdown rate at roughly 64%—meaning the pattern resolves to the downside about two-thirds of the time. This aligns with older studies from the 1970s and 1980s that found breakdown rates in the 60-70% range.
But here’s where it gets interesting. More recent analysis, including surveys conducted by online trading communities and brokerages, often show higher breakdown rates—some approaching 75% or even 80%. The discrepancy isn’t necessarily contradictory; it reflects different methodological choices. Bulkowski’s data typically requires the pattern to touch the support line at least twice before classifying it, while less rigorous analyses sometimes include formations that barely qualify.
The 64% figure is useful as a baseline, but it masks critical variations. In strong bull markets, descending triangles break to the upside more frequently—some analyses show breakout rates climbing to 40% or higher during major bullish trends. Conversely, during bear markets or prolonged downtrends, the breakdown rate can exceed 80%. The pattern doesn’t exist in a vacuum; it trades within the context of the broader market cycle.
During the 2020-2021 bull market recovery, many descending triangles that formed on individual stocks broke to the upside, catching short-siders off guard. Traders who blindly expected breakdown every time were fighting probability at precisely the wrong moments.
Why Breakdown Rates Vary So Much
Three primary factors explain the wide variance in reported breakdown rates: pattern definition, market condition, and confirmation criteria.
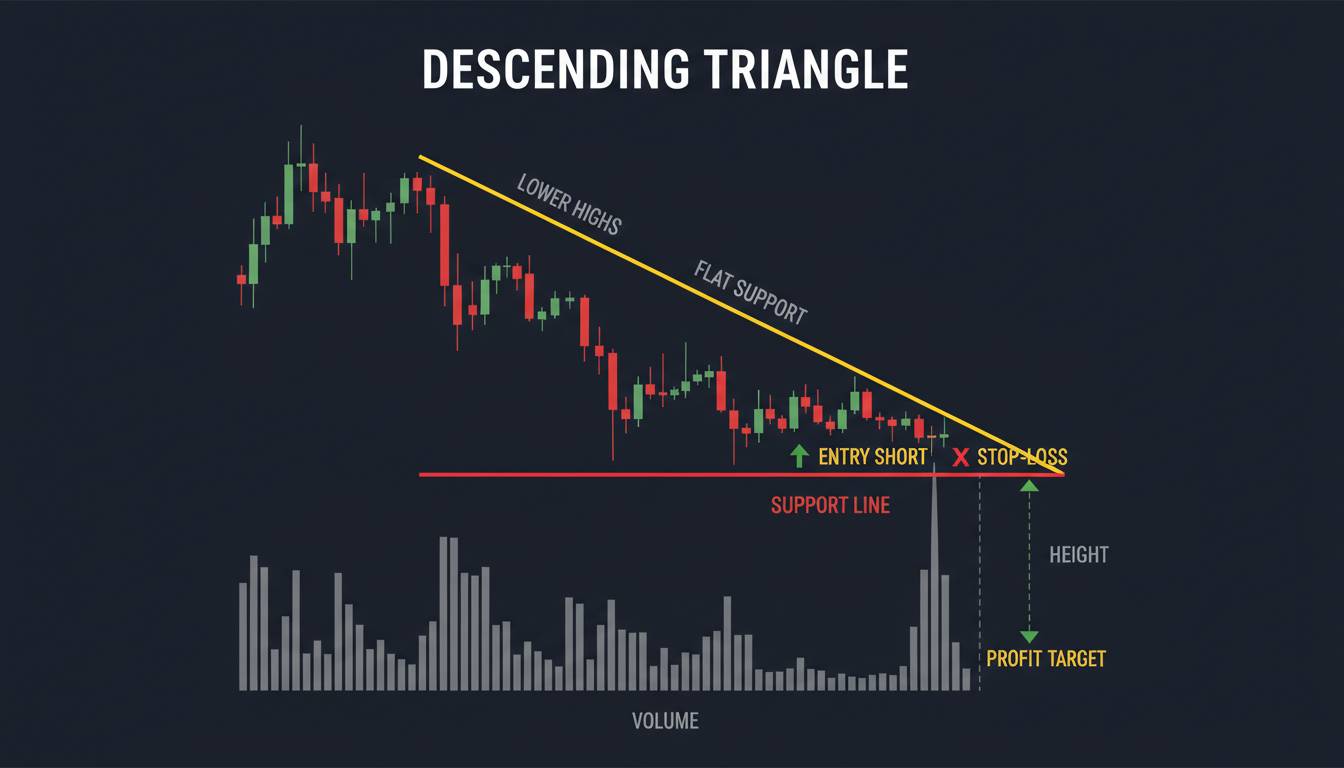
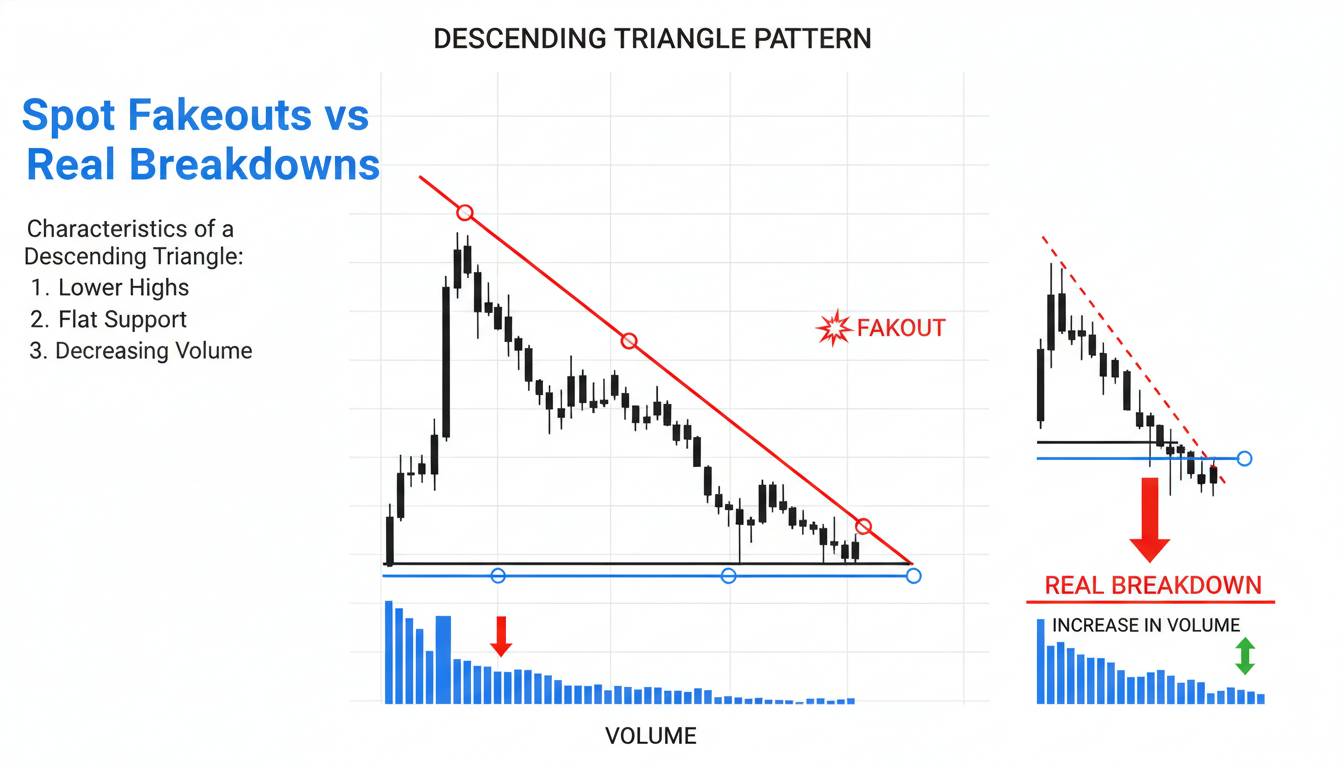
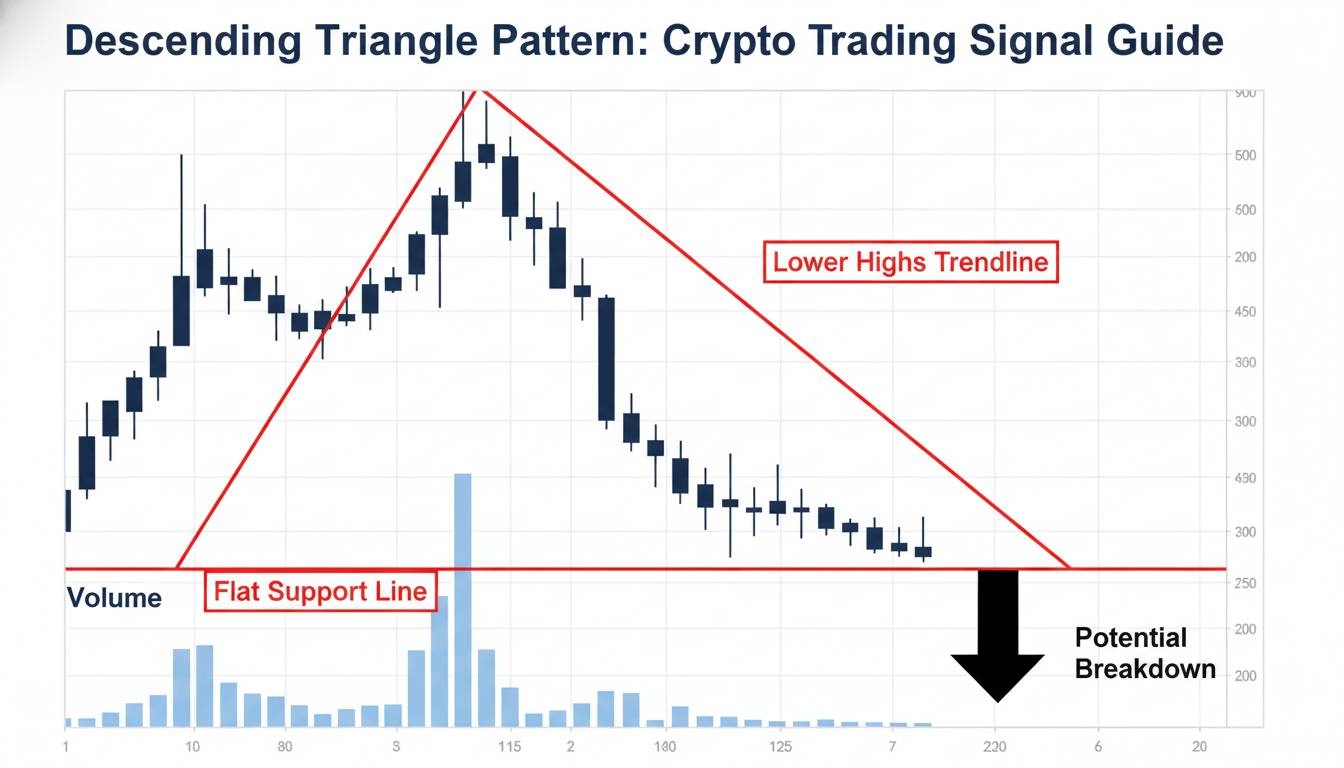
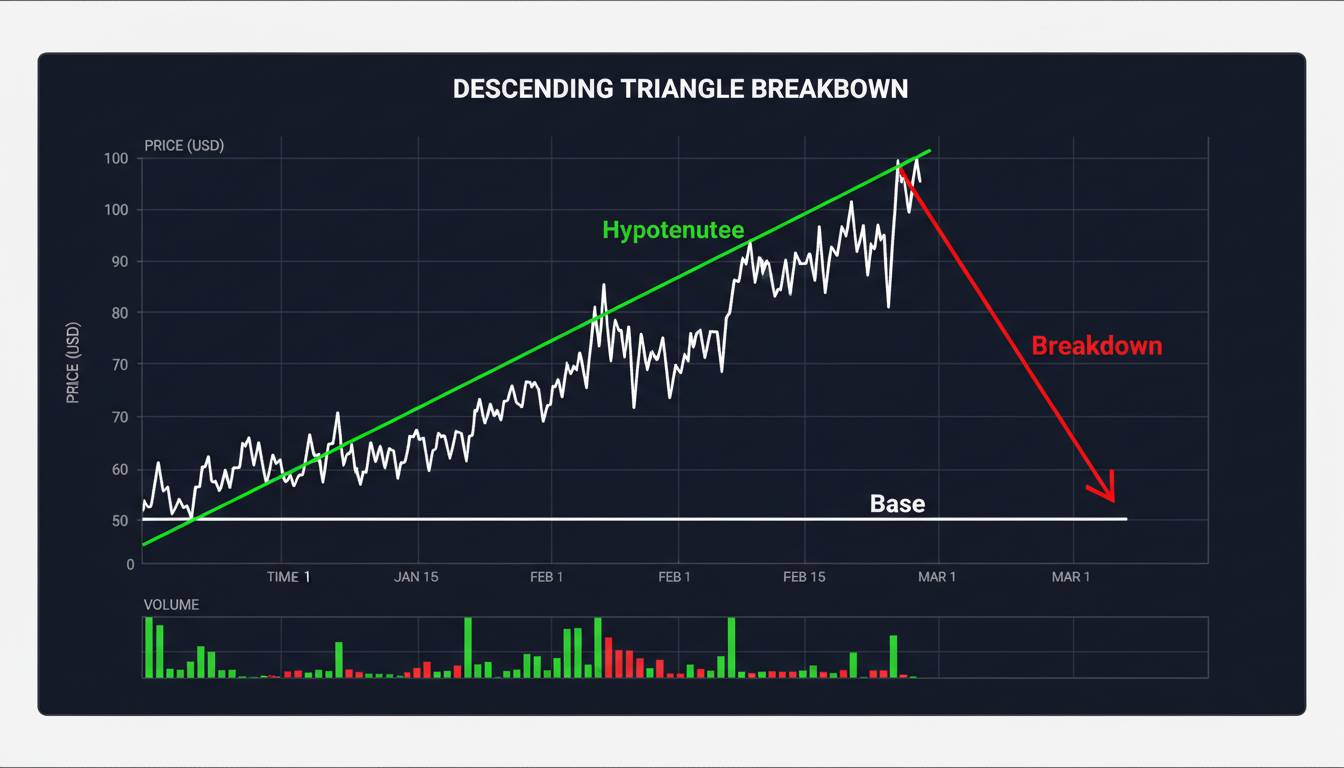
Pattern definition creates the biggest difference. A strict descending triangle requires horizontal support (at least two tests of the level) and a descending upper trendline (at least two tests of declining highs). Some analysts include patterns with only one touch on either line, which dilutes the sample with weaker formations. The tighter your definition, the higher the breakdown rate tends to be—because only well-formed, recognizable patterns deliver the expected outcome.
Market conditions matter more than most traders realize. The 64% breakdown rate Bulkowski documented reflects long-term historical data across all market conditions. But when you isolate specific environments, the numbers shift dramatically. During the 2008-2009 financial crisis, descending triangles on financial stocks broke down at rates approaching 90%. During the 2020-2021 recovery, the same pattern on technology stocks broke up perhaps 50% of the time or more.
Confirmation criteria determine whether you’re measuring the pattern itself or your entry strategy. If you only count breakdowns that occur on increased volume, the rate drops. If you count any violation of support as a breakdown—even one that immediately reverses—the rate climbs. Most published statistics don’t distinguish between these scenarios, which is why you see such a wide range of figures.
The honest answer to “how often does it break down?” is: it depends on how you’re counting and what market you’re trading. The 64-75% range is honest; anything claiming a single precise percentage is oversimplifying.
Comparing Triangle Patterns: The Complete Picture
Descending triangles don’t exist in isolation. Understanding how they perform relative to other triangle patterns gives you better context for expectations.
Ascending triangles show the opposite bias—they break to the upside approximately 70-75% of the time. This makes intuitive sense: ascending triangles form with flat resistance and rising support, suggesting buying pressure is building. The bullish bias is structural, not coincidental.
Symmetrical triangles split almost evenly, breaking up slightly more than half the time (roughly 54-56%). These consolidation patterns lack directional bias, and the market’s prevailing trend often determines the breakout direction. Trading symmetrical triangles profitably requires context—knowing whether you’re in a bull market or bear market matters enormously.
The key insight isn’t that one pattern is “better” than another. It’s that each pattern has a directional bias that varies by market condition. Descending triangles lean bearish, but that lean reverses in strong bull markets. Ascending triangles lean bullish, but underperform during bear markets. Symmetrical triangles are chameleons that take their direction from the surrounding environment.
If you’re trading descending triangles exclusively because you expect breakdown, you’re missing half the picture. The pattern is bearish, but not universally so. Your market context determines whether the bearish bias manifests or gets overcome by the prevailing trend.
Timeframe Dependencies: The Rule Nobody Talks About
The pattern’s reliability changes dramatically depending on which timeframe you’re analyzing. This is perhaps the most underappreciated factor in descending triangle performance.
On daily charts, the 64% breakdown rate applies reasonably well. Daily charts capture enough market noise to smooth out random fluctuations while remaining short enough to provide actionable signals. The pattern typically takes 1-3 months to form on daily charts.
On weekly charts, the breakdown rate appears higher—some analysts suggest 70% or above. Weekly charts filter out more short-term noise and tend to capture more significant structural breakdowns. The patterns take longer to form (often 3-6 months), but the signals are more significant.
On intraday charts (hourly or shorter), the pattern becomes considerably less reliable. Some studies suggest breakdown rates drop to 55-60% on hourly charts, with false breakdowns and whipsaws dominating. The pattern forms quickly (days to weeks), but the noise-to-signal ratio increases substantially.
This creates a practical tension: longer timeframes are more reliable but offer fewer signals. Shorter timeframes offer more opportunities but require tighter stops and carry higher transaction costs. Most retail traders would be better served focusing on daily and weekly charts for descending triangle analysis, despite the temptation to trade the pattern on faster timeframes for more action.
If you’re trading descending triangles on 15-minute charts expecting the same 64% breakdown rate, your results will likely be worse than the statistics suggest. The pattern works best where it has time to develop and where market participants are making significant decisions—on higher timeframes.
What Actually Improves Reliability
Certain conditions substantially improve or degrade the reliability of descending triangle breakdowns. Here’s what the data and experienced traders consistently point to:
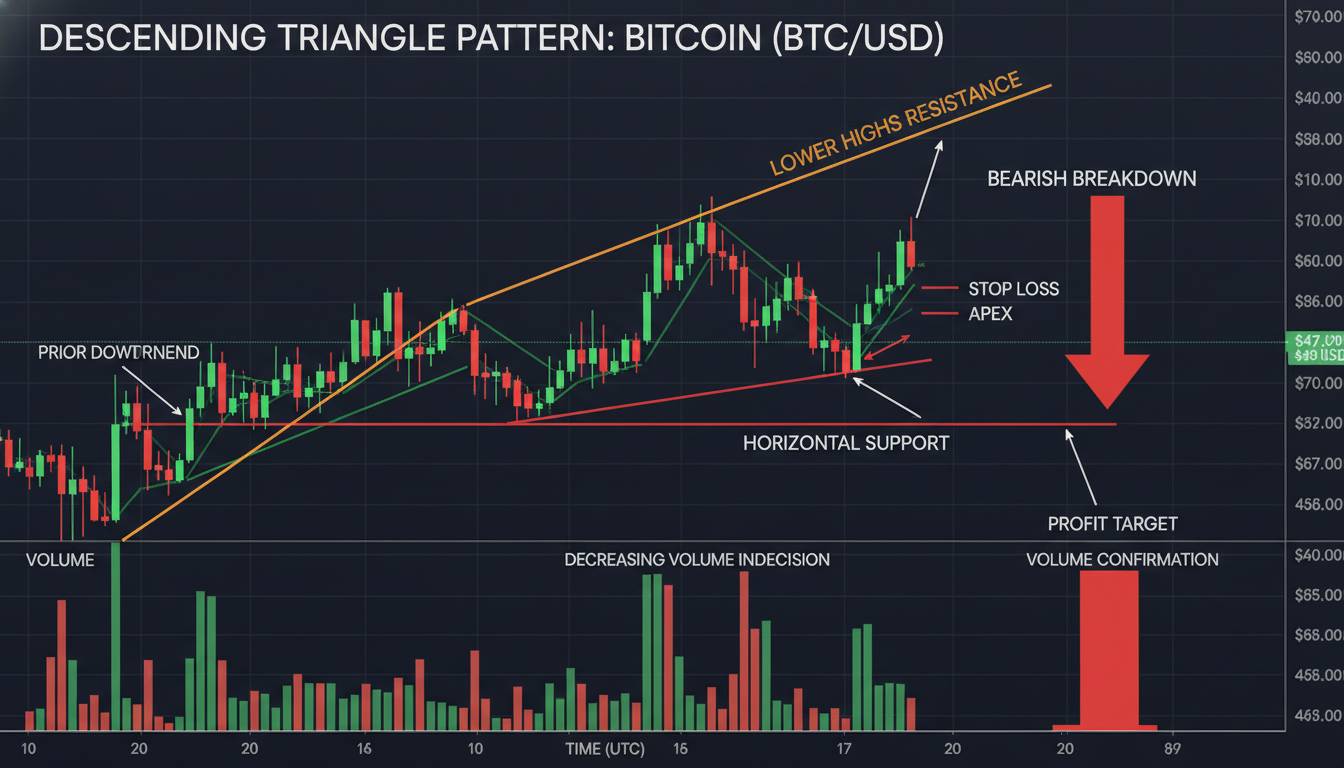
Volume on breakdown matters enormously. When a descending triangle breaks down on expanding volume—ideally 50% above average—the breakdown succeeds perhaps 75-80% of the time. When volume contracts on the breakdown, success rates drop to near 50%. Volume is your confirmation filter; ignoring it is choosing to trade with a handicap.
The surrounding trend sets the baseline probability. A descending triangle in an established downtrend breaks down more often than one forming after an extended uptrend. The pattern amplifies existing momentum rather than reversing it. Trading against the prevailing trend with a descending triangle is fighting the tape; it can work but requires exceptional timing.
The horizontal support level must have been tested multiple times. A support level tested three or four times is stronger than one tested twice—and therefore more likely to hold if the breakdown fails. Conversely, a “descending triangle” with only one touch on support isn’t really a descending triangle; it’s a falling wedge or just random price action.
The slope of descent into the pattern affects reliability. If price falls sharply into the formation (creating a steeper left side of the triangle), the bearish momentum often continues through the breakdown. A gradual approach suggests weaker conviction and increases the chance of false breakdowns.
These factors don’t guarantee outcomes, but they shift probability meaningfully. A descending triangle breaking down on expanding volume, in a bear market, after multiple tests of a strong support level—this is a high-probability setup. The opposite scenario—a breakdown on declining volume, in a bull market, with a weak support test—explains why many traders lose money on this pattern.
Common Mistakes Traders Make With This Pattern
After studying both the data and real trader behavior, I see three mistakes that consistently destroy accounts:
Mistake one: expecting breakdown in a bull market. The most costly error is assuming the pattern always breaks down regardless of context. During strong uptrends, ascending triangles break up and descending triangles break up far more often than the base rate suggests. Your job is to identify the market regime first, then apply pattern probabilities conditionally.
Mistake two: trading the pattern before confirmation. Many traders enter short positions when price approaches support, “expecting” the breakdown. This is speculation, not trading. The pattern isn’t complete until support breaks. Entering early means paying to be stopped out while waiting for an outcome that may never arrive. Waiting for confirmed breakdown on increased volume costs you a few points of entry price but dramatically improves your hit rate.
Mistake three: ignoring the stop-loss location. Trading a descending triangle breakdown without a clear stop-loss plan is asking for a blow-up. The natural stop-loss location is above the upper trendline (for short positions)—but this can be quite far from support, especially in wide triangles. Some traders use the recent high within the pattern; others place stops above the resistance trendline. Either way, you need to know your risk before entering.
The pattern works, but only if you respect the context, wait for confirmation, and manage your risk. None of this is complicated, yet the majority of traders fail on all three fronts.
Practical Trading Implications
If you’re going to trade descending triangles, here’s how to apply what you’ve learned:
First, identify your market context. Are we in a confirmed uptrend, downtrend, or range? This determines whether you should bias toward breakdown or breakout. In a strong uptrend, consider going long if the pattern breaks upward; fighting the trend with shorts is low-probability work.
Second, wait for confirmed breakdown. The pattern completes when price closes below the horizontal support, preferably on increased volume. Don’t guess; wait for confirmation.
Third, measure your risk before entering. Calculate where you’ll exit if the trade goes against you. The stop-loss location should be logical (above the pattern) and acceptable (within your position-sizing rules). If the stop is too far away, either skip the trade or size smaller.
Fourth, take profit strategically. There’s no universal target for descending triangle breakdowns. Some traders use the pattern’s height projected downward; others trail stops as price falls. What matters is that you have an exit plan, not that you hope for the best.
Fifth, track your results. The only way to know whether you’re getting the expected 64% breakdown rate—or whatever your specific market and timeframe delivers—is to log your trades and measure. Most traders don’t, and they remain ignorant of their actual edge.
The pattern has an edge. It’s not a guarantee, but it provides a statistical probability that, when combined with proper risk management, can produce positive expected value. That’s more than most trading approaches can claim.
The Unresolved Question
One thing the data doesn’t fully answer: how has the reliability of descending triangles changed as technical analysis has become more widely practiced?
There’s a plausible argument that patterns become less reliable as more traders recognize and trade them. When fewer people understood descending triangles, the breakdown trades were more “pure”—driven by genuine supply and demand imbalances. Now that millions of traders watch for the same patterns, the game has evolved. Institutions are aware of where retail stops cluster, and algorithmic traders can exploit predictable behavior.
I don’t have clean data on whether breakdown rates have shifted over the past two decades. Bulkowski’s studies span decades, but they aggregate across all periods, making temporal trends hard to identify. What I can say is that if pattern reliability has decreased, the effect hasn’t been large enough to eliminate the bearish bias—the pattern still breaks down more often than not.
Whether that continues over the next twenty years remains an open question. The market adapts. Your edge, if you develop one, will require more than recognizing the pattern—it will require understanding when the pattern’s probability shifts and adjusting accordingly. The traders who succeed won’t be the ones who memorized “64% breakdown rate.” They’ll be the ones who understood why that number varies and adapted to the conditions in front of them.