Bitcoin has experienced multiple severe drawdowns throughout its existence. Understanding these crashes means recognizing the patterns that repeat and the forces that drive them. If you’re investing in or considering cryptocurrency, you need to know what these crashes actually look like, why they happen, and whether the historical patterns still hold.
This article breaks down every major Bitcoin crash in history, examines the specific triggers that caused them, and analyzes what this means for the future of the market.
What Exactly Is a Bitcoin Crash?
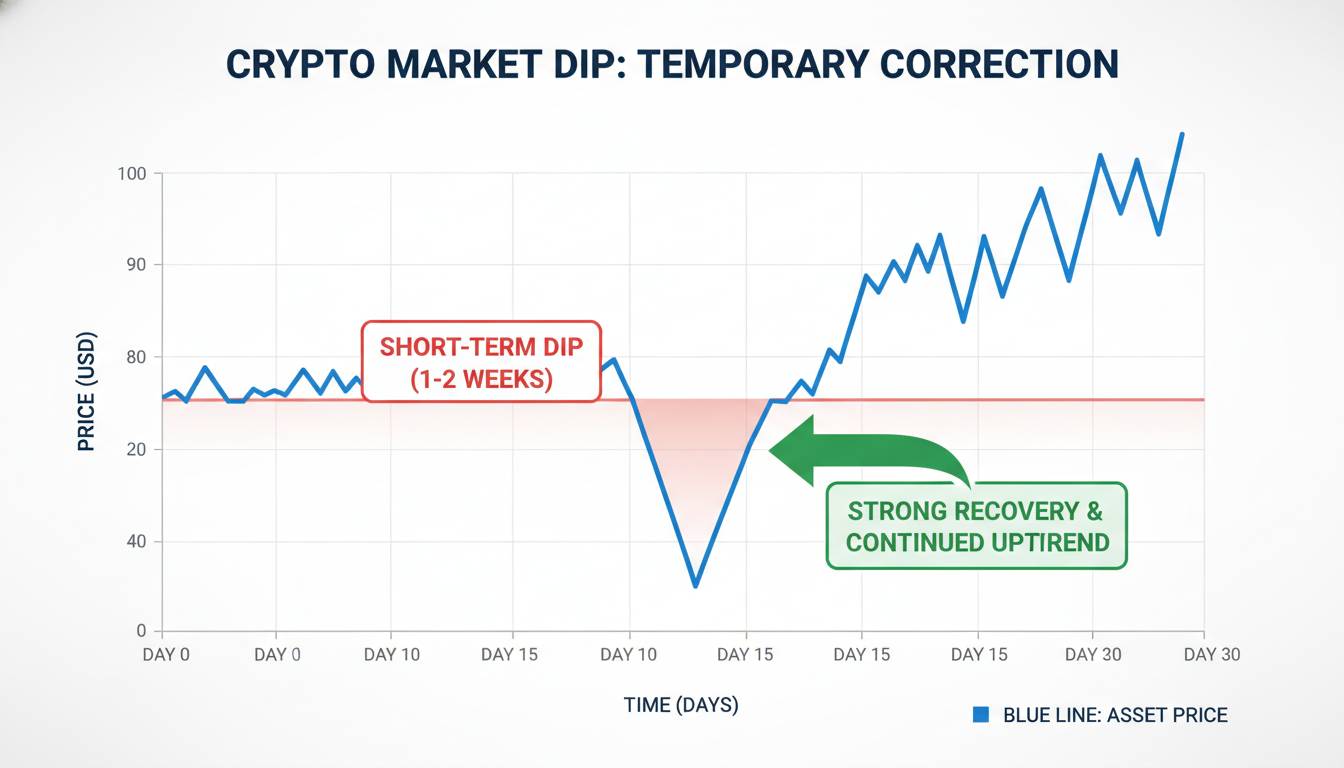
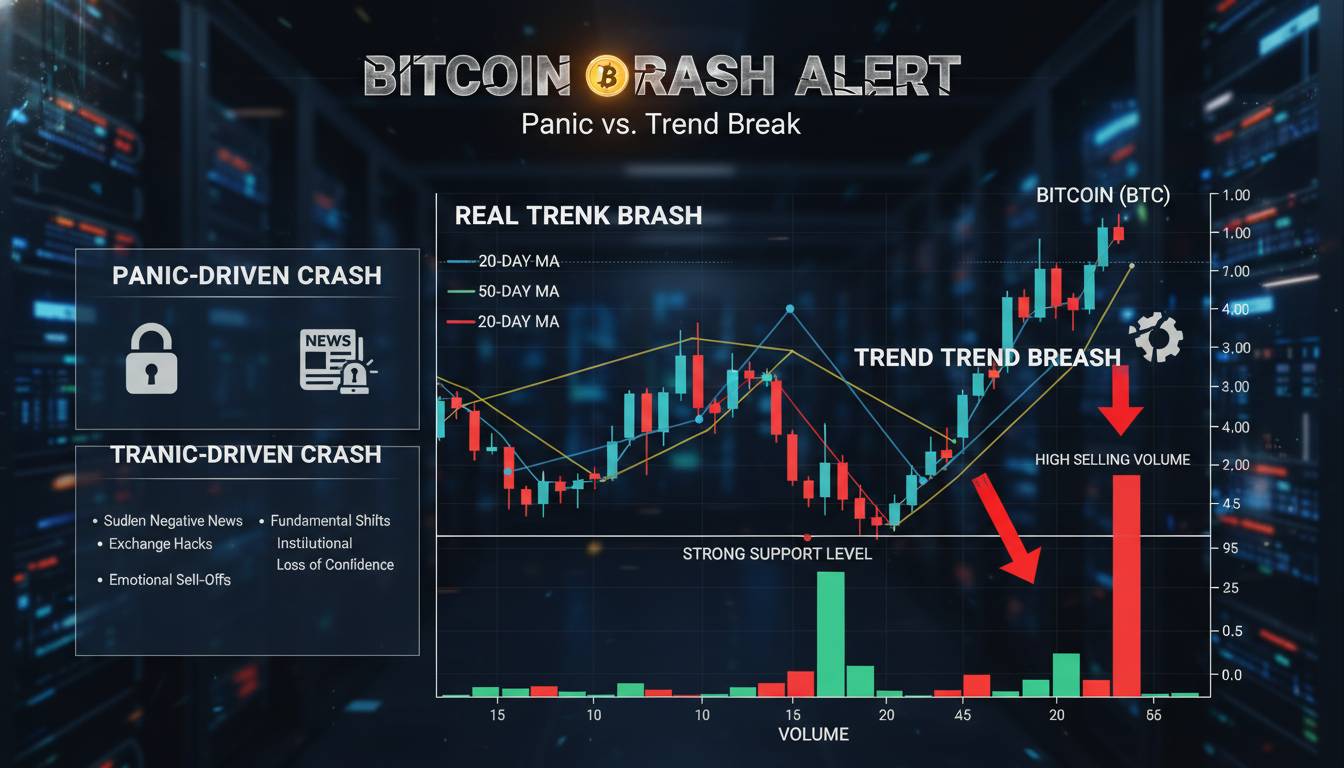
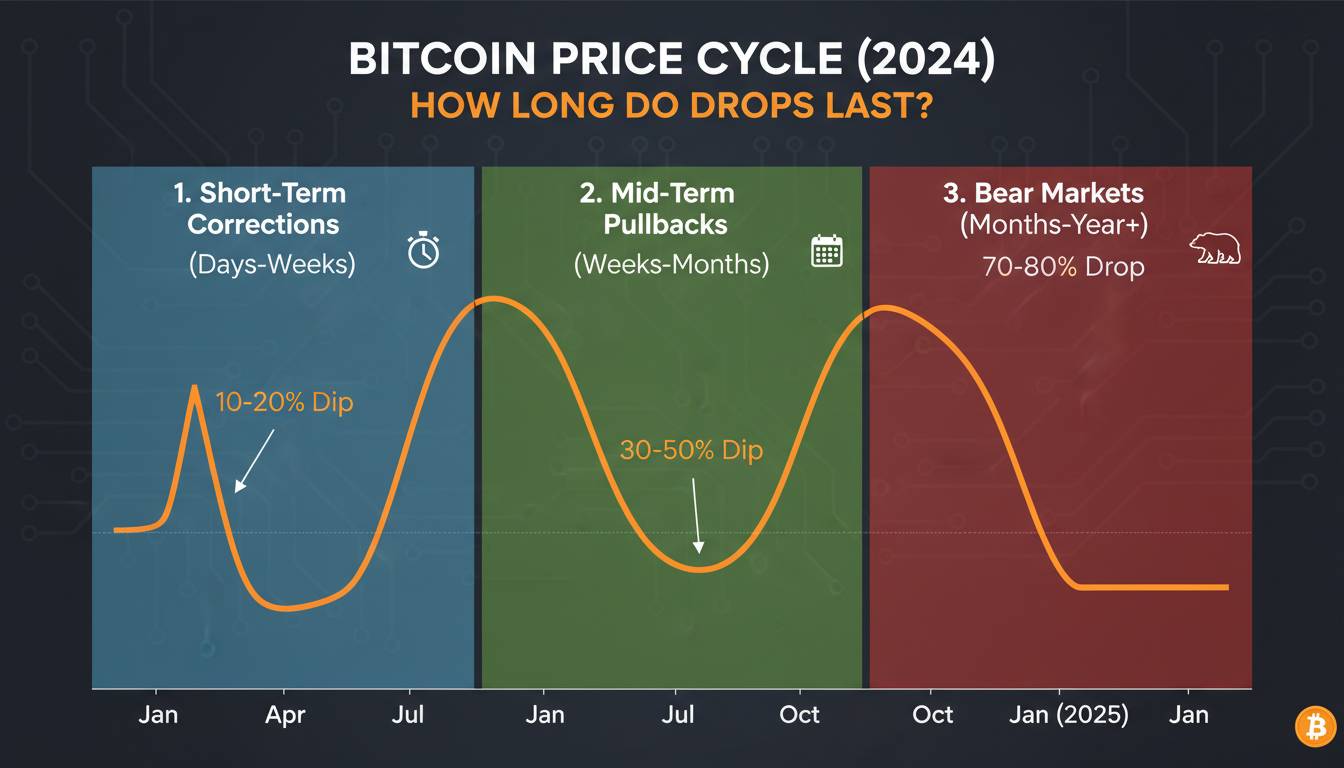
A Bitcoin crash is a rapid and significant decline in the price of Bitcoin, typically dropping 50% or more within weeks or months rather than years. Unlike a gradual bear market, a crash involves panic selling, cascading liquidations, and often a breakdown of technical support levels that had previously held.
The distinction between a correction and a crash comes down to magnitude and speed. A 20% pullback might be uncomfortable, but it falls within normal market fluctuations for an asset like Bitcoin. A true crash sees the market lose confidence en masse, triggering capitulation—the point where even long-term holders abandon their positions.
Bitcoin’s crashes have historically been more severe than traditional asset drawdowns because the market is smaller, less regulated, and populated by participants with varying levels of sophistication. This creates momentum dynamics that amplify both upward and downward moves.
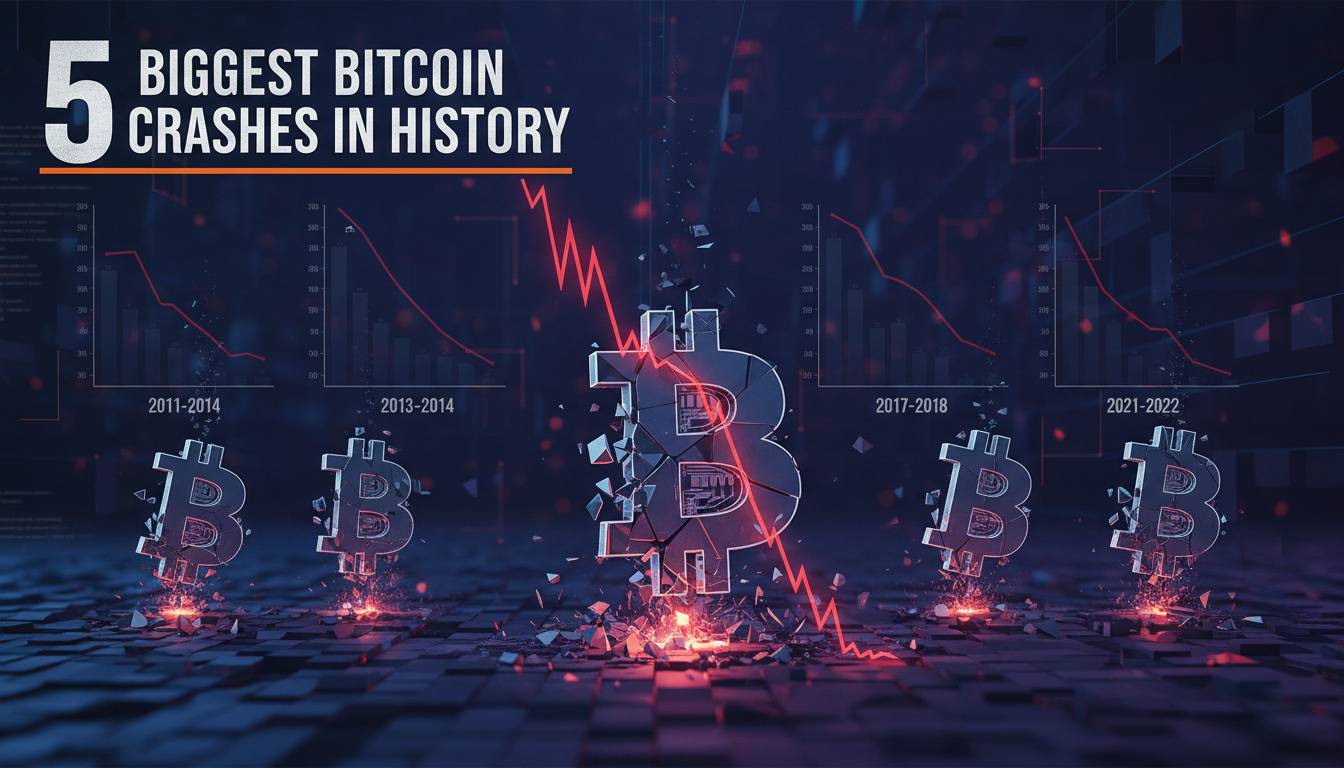
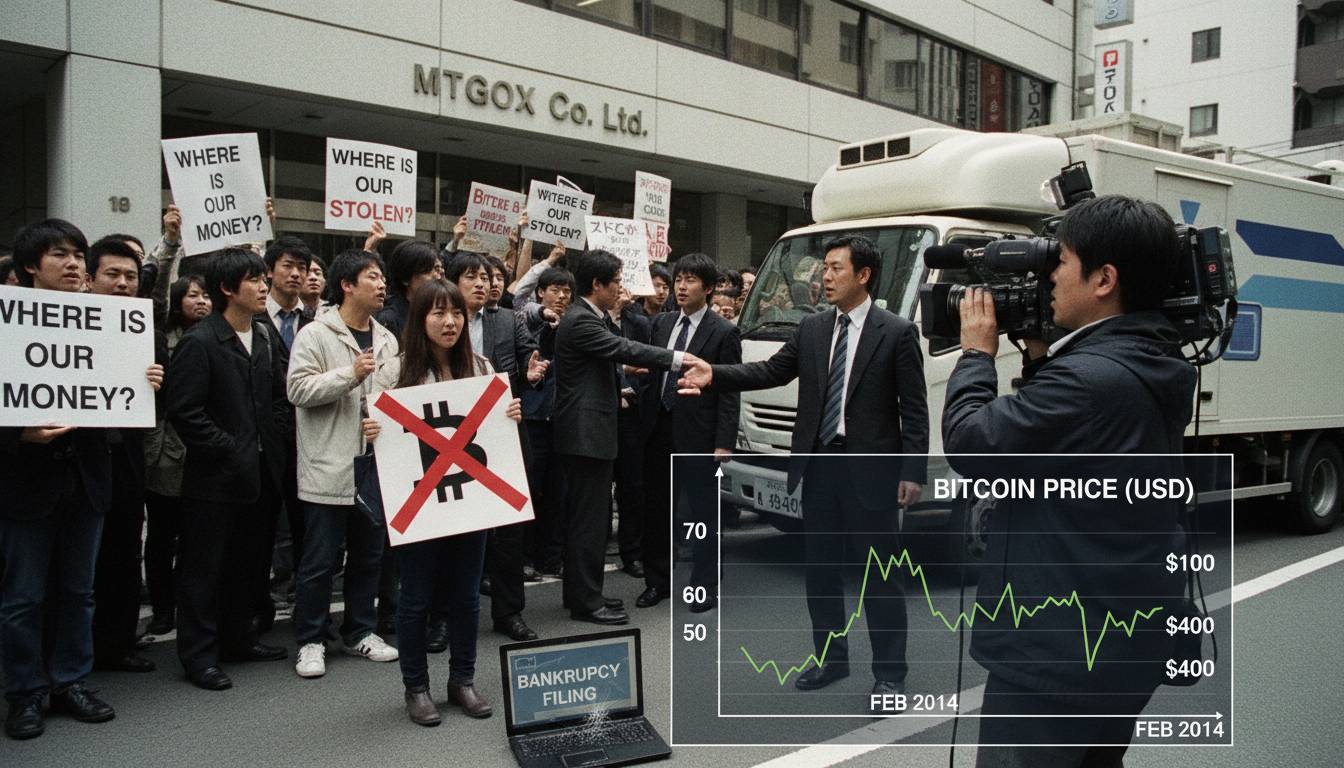
The 2013-2014 Crash: The First Major Test
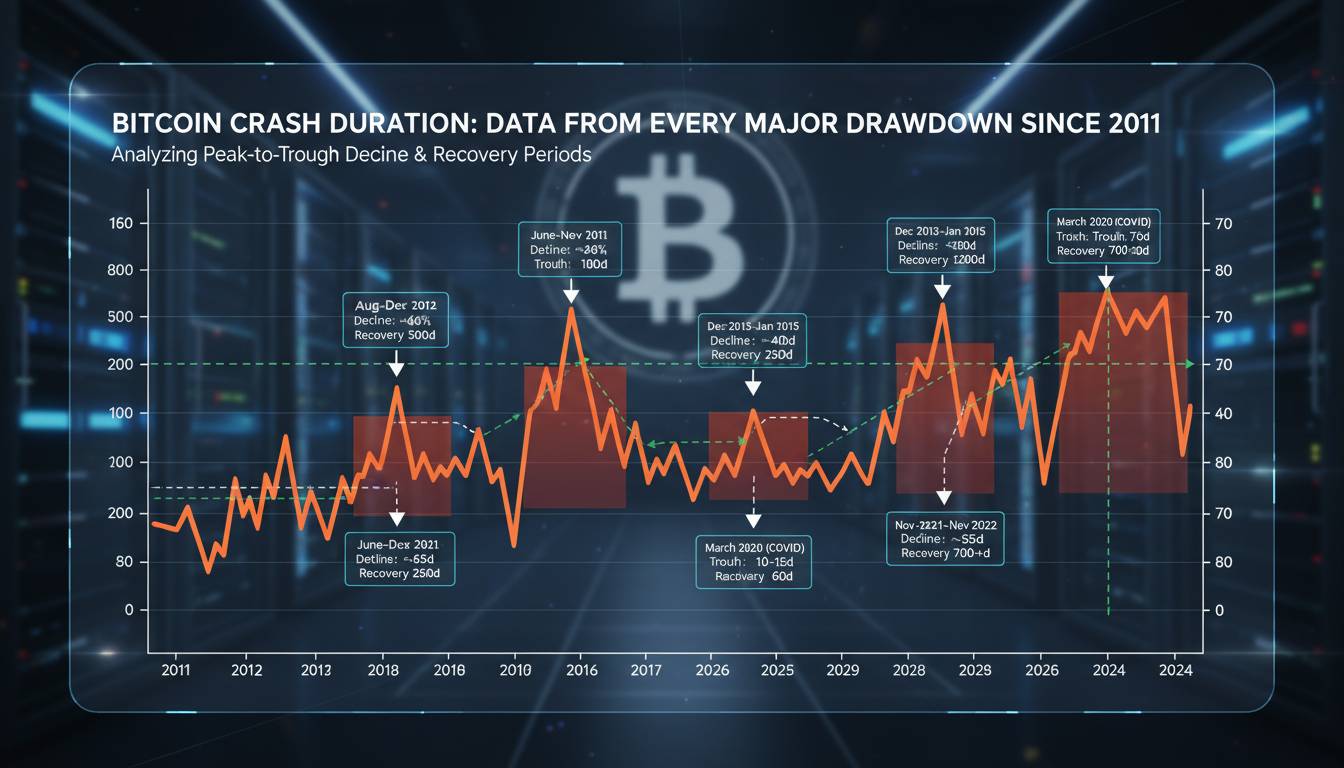
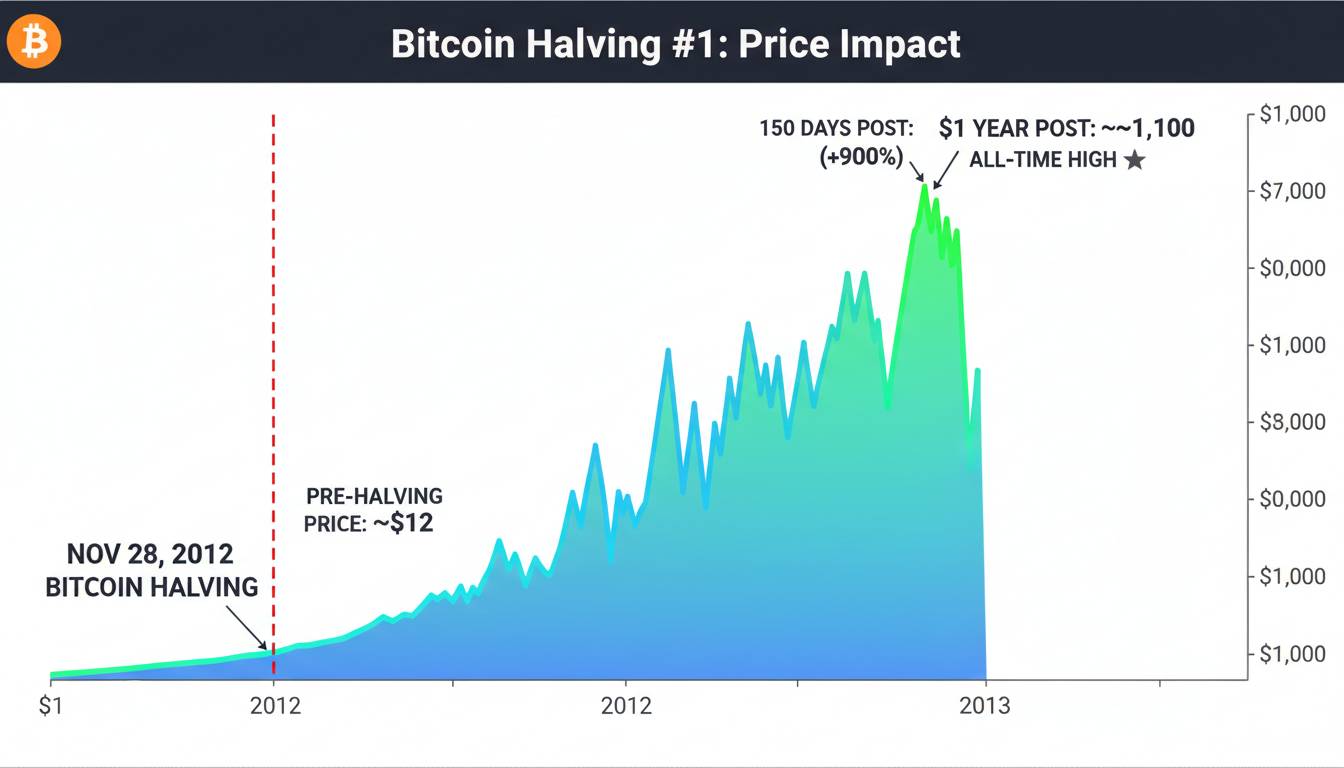
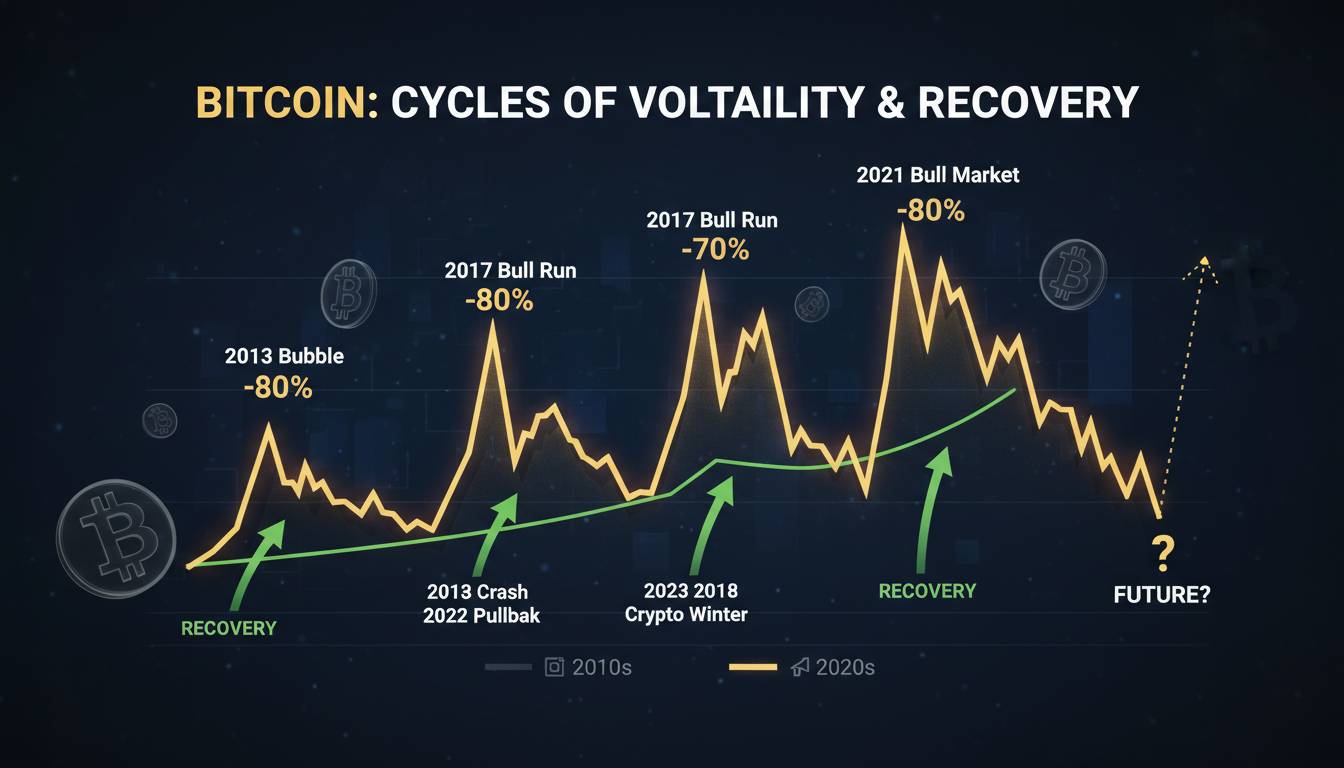
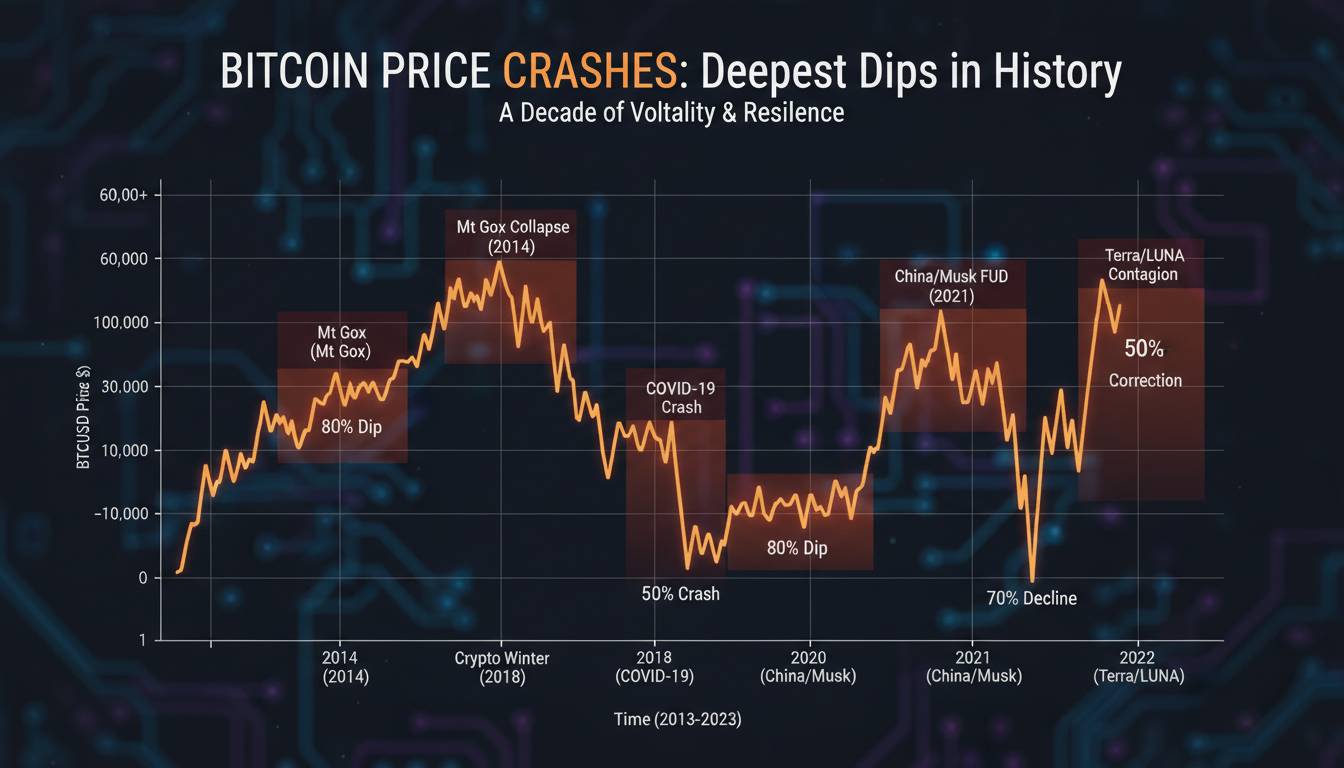
Bitcoin’s first true crash came in late 2013 and stretched into 2014. After reaching approximately $1,100 in December 2013, Bitcoin collapsed to around $150 by early 2014—an 86% decline that wiped out most of the gains from that speculative bubble.
The trigger was a combination of factors. Mt. Gox, which handled the majority of Bitcoin trading at the time, collapsed in February 2014 after revealing it had lost approximately 850,000 Bitcoin (worth around $450 million at the time) to hacking. This wasn’t just an exchange failure—it was a fundamental crisis of trust in the entire Bitcoin infrastructure.
The crash also exposed how thin the market was. With limited exchange options and no institutional infrastructure, even moderate selling pressure created outsized price drops. Many early adopters who had accumulated Bitcoin in 2010 and 2011 sold their holdings during this period, either to realize profits or because they lost confidence entirely.
What makes this crash instructive is the recovery time. Bitcoin didn’t surpass its previous all-time high until early 2017—nearly three years later. When crashes destroy confidence this thoroughly, rebuilding takes considerably longer than the crash itself.
The 2017-2018 Crash: The ICO Mania Peak
The next major crash followed a dramatically different pattern. Bitcoin’s 2017 rally was driven by mainstream attention—the launch of futures contracts on CME and CBOE, growing retail interest, and the Initial Coin Offering (ICO) boom that saw hundreds of new tokens launch using Ethereum.
Bitcoin reached nearly $20,000 in December 2017. Then the bottom fell out.
By December 2018, Bitcoin had fallen to approximately $3,200—an 84% decline that destroyed hundreds of billions in market capitalization. The percentage drop was nearly identical to the 2014 crash, but the absolute dollar amounts were vastly larger, and the market impact was proportionally more devastating.
The causes were multifaceted. The ICO boom had created massive speculative demand for Ethereum and new tokens, but when the market began to turn, many of these projects proved to be fraudulent or simply incompetent. The Securities and Exchange Commission began cracking down on unregistered token sales, and overall sentiment shifted dramatically.
Perhaps more importantly, this crash revealed how leverage had infected the Bitcoin market. Major exchange failures and margin liquidations cascaded through the system, with some analysts estimating that over $5 billion in long positions were liquidated during the decline. Leverage accelerates both gains and losses, and during a crash, it creates cascading failures.
The recovery from this crash was faster than many expected. Bitcoin had returned to $10,000 by late 2020, and by late 2021, it would reach new highs near $69,000. This recovery timeframe—roughly three years from bottom to new highs—became a reference point for bull market expectations.
The March 2020 COVID Crash: The Black Swan Event
In March 2020, the world faced an unprecedented global pandemic, and markets of all kinds experienced catastrophic selloffs. Bitcoin was no exception, dropping from approximately $10,000 in mid-February to around $3,800 by mid-March—a 62% decline in less than a month.
This crash was uniquely tied to global macroeconomic panic. As governments implemented lockdowns and markets crashed across all asset classes, Bitcoin’s correlation with traditional markets reached historic highs. The narrative that Bitcoin served as an uncorrelated asset or digital gold was severely tested, and it failed that test spectacularly in the short term.
The trigger wasn’t specific to Bitcoin—it was a liquidity crisis. As the S&P 500 crashed and flight-to-cash dynamics dominated, investors sold everything they could, including Bitcoin. The rapidity of the decline suggested that many Bitcoin holders were also traditional market participants who needed to raise cash for margin calls or other obligations.
What made this crash remarkable was the recovery. Unlike previous crashes that took years to recover from, Bitcoin’s March 2020 low was followed by one of the most explosive bull runs in its history. By December 2020, Bitcoin had already surpassed its previous all-time high, and by April 2021, it had reached $64,000. The entire drawdown was recovered in roughly eight months.
This recovery pattern suggested that the 2020 crash was fundamentally different from previous crashes—an external shock to the entire financial system rather than an internal Bitcoin crisis. When the broader market recovered, Bitcoin recovered faster and more dramatically than almost anyone expected.
The 2022 Crash: The Perfect Storm
The 2022 crash was perhaps the most damaging in Bitcoin’s history, not because of the percentage decline—though at 77%, it was severe—but because of what it revealed about the ecosystem and how it cascaded through multiple interconnected failures.
Bitcoin peaked at approximately $69,000 in November 2021 and bottomed at approximately $16,000 by November 2022. The decline took nearly a year, but the most dramatic phase came in the spring and fall of 2022 when multiple major events shook confidence.
The primary triggers were the collapse of the Terra/Luna ecosystem, the failure of Three Arrows Capital (a prominent crypto hedge fund), and the bankruptcy of FTX, one of the largest cryptocurrency exchanges. Each event created cascading effects that amplified the decline.
When Terra’s algorithmic stablecoin UST collapsed in May 2022, it took down billions in value and triggered a liquidity crisis across the crypto lending sector. Three Arrows Capital’s failure in June revealed the extent of leverage embedded in the system, as the fund’s collapse caused losses for multiple lenders and counterparties.
Then came FTX’s November 2022 bankruptcy, which shocked even cynical crypto observers. The exchange, which had been valued at $32 billion and counted mainstream financial institutions among its investors, had apparently been operating with essentially no meaningful oversight or internal controls. An estimated $8 billion in customer funds was missing.
This crash demonstrated that Bitcoin’s price could be heavily influenced by failures in the broader crypto ecosystem. While Bitcoin itself wasn’t fraudulent, it traded in markets filled with fraudulent actors, and the reputational damage affected the entire asset class.
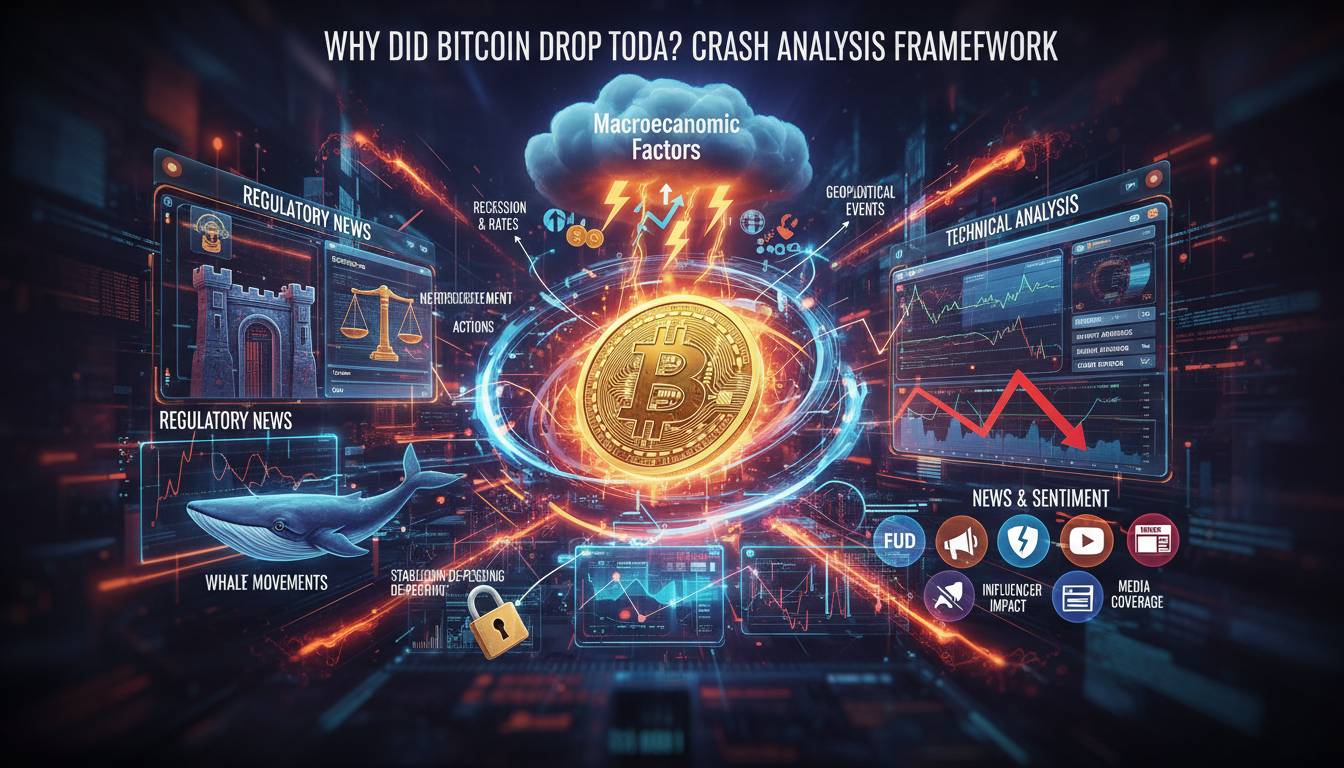
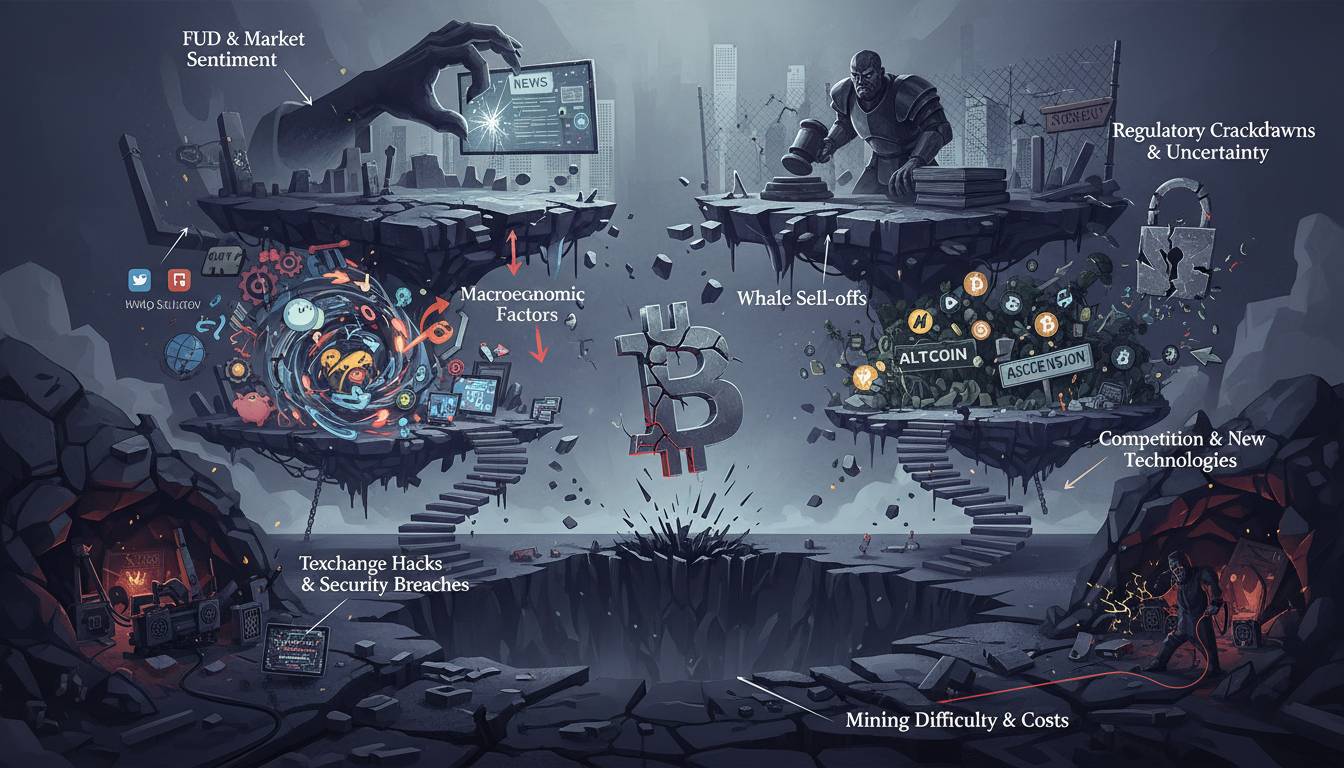
What Actually Causes Bitcoin Crashes
Looking across these historical events, certain patterns emerge consistently.
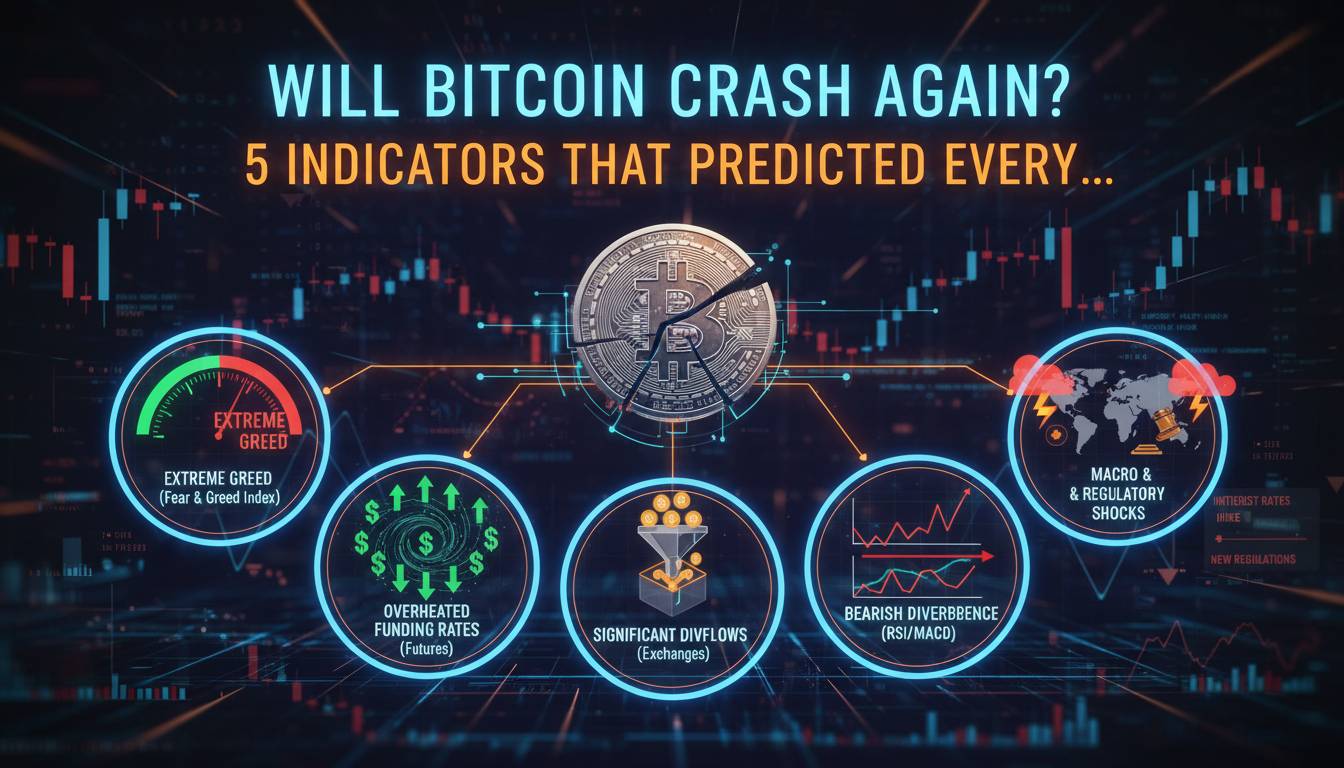
Leverage and margin appear in nearly every major crash. When prices begin declining, over-leveraged positions are liquidated automatically, creating more selling pressure, which triggers more liquidations. This cascade effect is particularly pronounced in crypto because the market operates 24/7 and many participants use extremely high leverage—10x, 20x, or more is common on certain exchanges.
Regulatory uncertainty has triggered multiple crashes, particularly when major governments announce enforcement actions or restrictive policies. China’s multiple crackdowns on cryptocurrency trading and mining (particularly the May 2021 ban and the subsequent mining shutdown) caused significant drops, as did various SEC enforcement actions against exchanges and token issuers.
Macroeconomic factors became increasingly relevant after 2020. Rising interest rates, inflation concerns, and general risk-off sentiment in traditional markets have correlated strongly with Bitcoin declines. The 2022 crash coincided with the Federal Reserve’s aggressive rate-hiking cycle, which reduced appetite for speculative assets.
Ecosystem-specific failures can trigger crashes even when Bitcoin itself isn’t directly affected. The Mt. Gox failure in 2014, the ICO bust in 2018, and the Terra/FTX failures in 2022 all created cascading effects that dragged Bitcoin down despite the underlying asset continuing to function.
Sentiment and momentum matter more in crypto than in traditional markets because a larger percentage of participants are trading on technical indicators and short-term price action. When key support levels break, algorithmic trading systems automatically sell, creating self-fulfilling prophecy declines.
Recovery Patterns and What They Tell Us
Recovery time—the period between the bottom and a return to previous highs—is one of the most important metrics for understanding Bitcoin crashes.
The 2014 crash took approximately three years to recover from. The 2018 crash also took roughly three years from bottom to new highs. The 2020 crash recovered in under a year. The 2022 crash, as of early 2025, is still in recovery mode, though Bitcoin has climbed significantly from its lows.
These recovery times suggest that the nature of the crash matters more than the depth. External shocks that don’t fundamentally damage the Bitcoin ecosystem (like the COVID crash) tend to recover faster. Crashes that reveal fundamental problems with the ecosystem or with how Bitcoin is traded and regulated tend to have longer recovery periods.
There’s also a psychological component. After each crash, the prevailing sentiment shifts dramatically from bullish to bearish, and it takes time for new participants to enter the market and push prices back up. This is why recoveries often coincide with new narrative developments—a new use case, institutional adoption, or macroeconomic shift that attracts fresh capital.
FAQ: Common Questions About Bitcoin Crashes
How deep did Bitcoin crash in 2022?
Bitcoin fell approximately 77% from its November 2021 high of $69,000 to its November 2022 low of around $16,000. This was the second-largest percentage decline in Bitcoin’s history, behind only the 2014 crash.
Has Bitcoin ever crashed before?
Yes, Bitcoin has experienced multiple major crashes: 2014 (86% drop), 2018 (84% drop), 2020 (62% drop), and 2022 (77% drop). Each crash was followed by recovery and subsequent new highs, though the timeframes varied significantly.
How long did Bitcoin take to recover from past crashes?
Recovery times have varied: the 2014 crash took roughly three years to recover, the 2018 crash also took about three years, the 2020 crash recovered in approximately eight months, and the 2022 crash is still in progress as of early 2025.
What causes Bitcoin to crash?
Bitcoin crashes are typically caused by a combination of factors including leverage-induced liquidations, regulatory announcements, macroeconomic shifts, and failures in the broader cryptocurrency ecosystem. No single cause consistently triggers crashes—in most cases, multiple factors converge.
Looking Forward
The pattern across Bitcoin’s history suggests that crashes are not only inevitable but, in some sense, necessary. Each crash has eliminated overleveraged participants, exposed fraudulent actors, and ultimately led to a more mature market. The percentage declines have actually been decreasing over time—from 86% to 84% to 62% to 77%—suggesting the market is gradually becoming more resilient.
However, this doesn’t mean future crashes will be less damaging in absolute terms. As the total value locked in Bitcoin increases, even smaller percentage drops represent larger dollar losses. The triggers may also evolve—regulatory crackdowns could become more severe, or new forms of leverage could emerge that we haven’t seen yet.
The honest truth is that nobody can predict when the next crash will occur or how severe it will be. What the history does provide is context: if you’ve experienced an 80% drawdown before and survived, you have the psychological framework to handle it again. If you’re entering the market during a period of relative stability, you should understand that volatility of this magnitude is normal, not exceptional.
Bitcoin has recovered from every crash in its history. Whether that pattern continues depends on factors that extend far beyond the cryptocurrency itself—on broader adoption, regulatory clarity, and the evolution of the financial systems Bitcoin was designed to operate within.