
Bitcoin has crashed before. Dramatically. The kind of drops that make headlines like “Bitcoin is dead” appear across financial media. Yet somehow, the cryptocurrency keeps finding its way back to new all-time highs. The question isn’t whether Bitcoin can recover — history proves it does — but rather what the on-chain data actually tells us about the timing and conditions that precede those recoveries. I’m going to walk you through the specific metrics that historically signal a bottom, compare the current landscape to past crash scenarios, and be honest about where the data gets fuzzy.
This isn’t investment advice. It’s an analysis of what the blockchain actually shows us.
The Historical Pattern: Bitcoin Recovers, But Not On Your Timeline
Let me start with the uncomfortable truth that every Bitcoin holder needs to internalize: Bitcoin always recovers, but the wait can be agonizing.
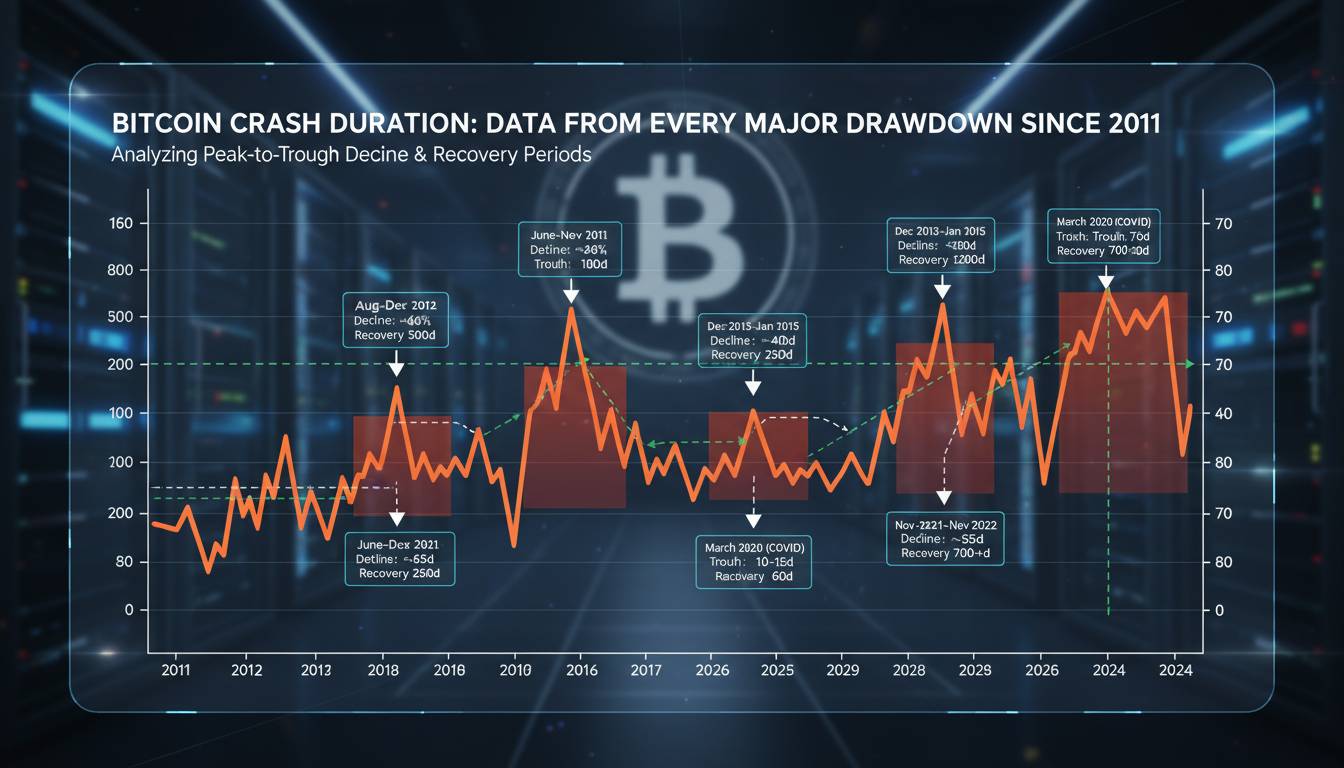
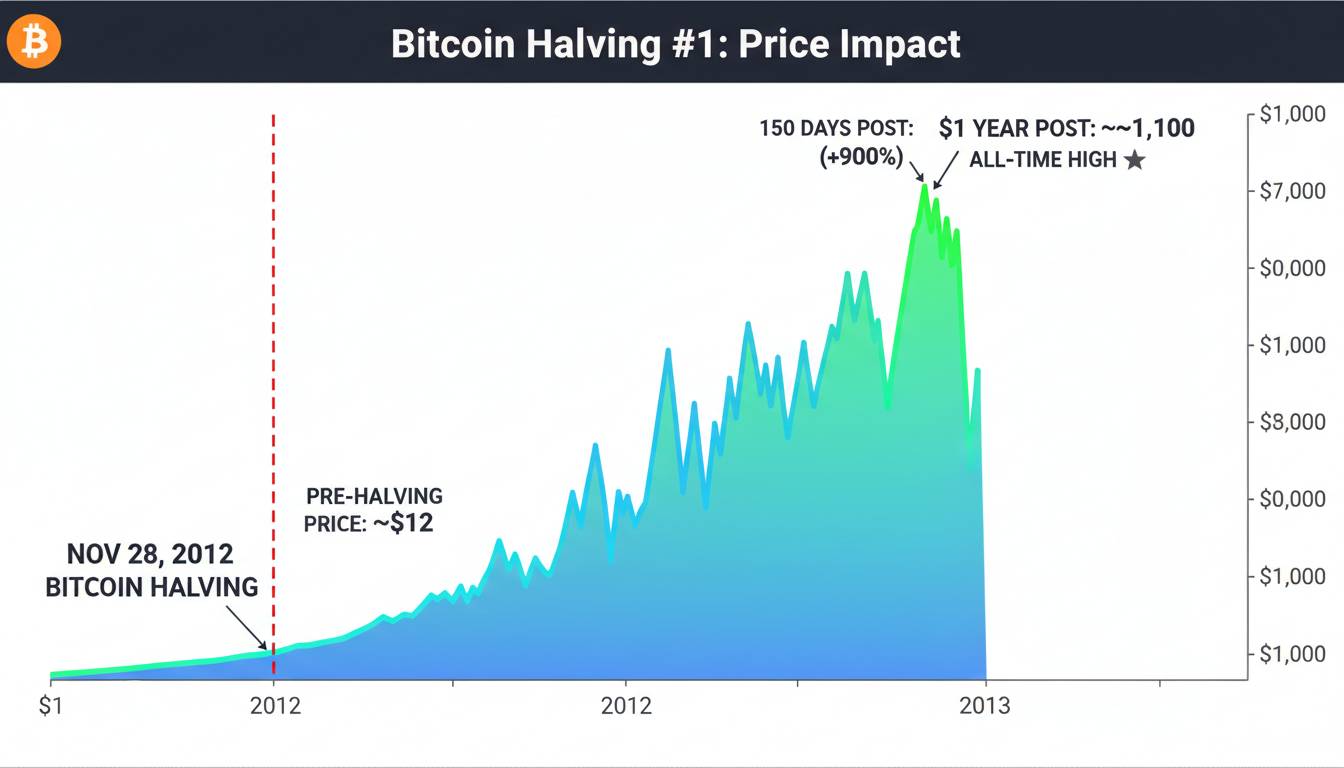
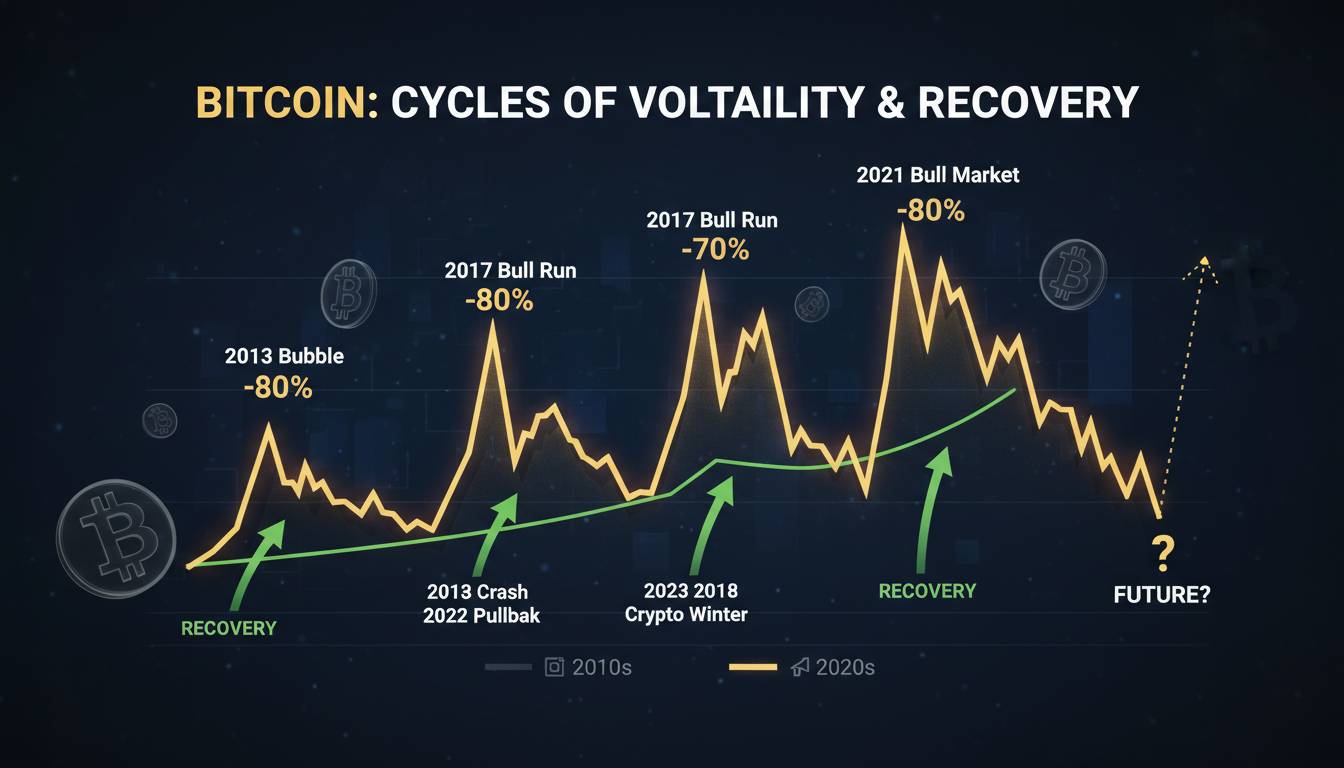
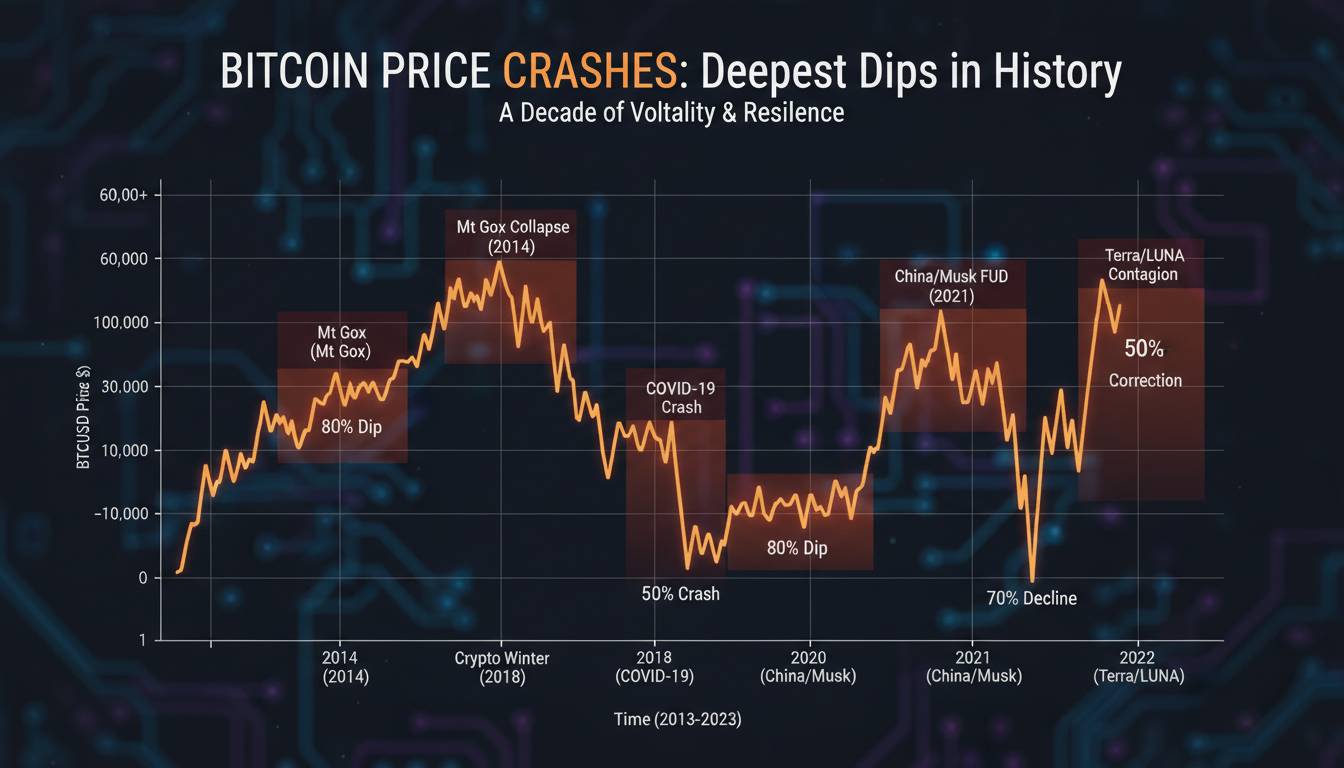
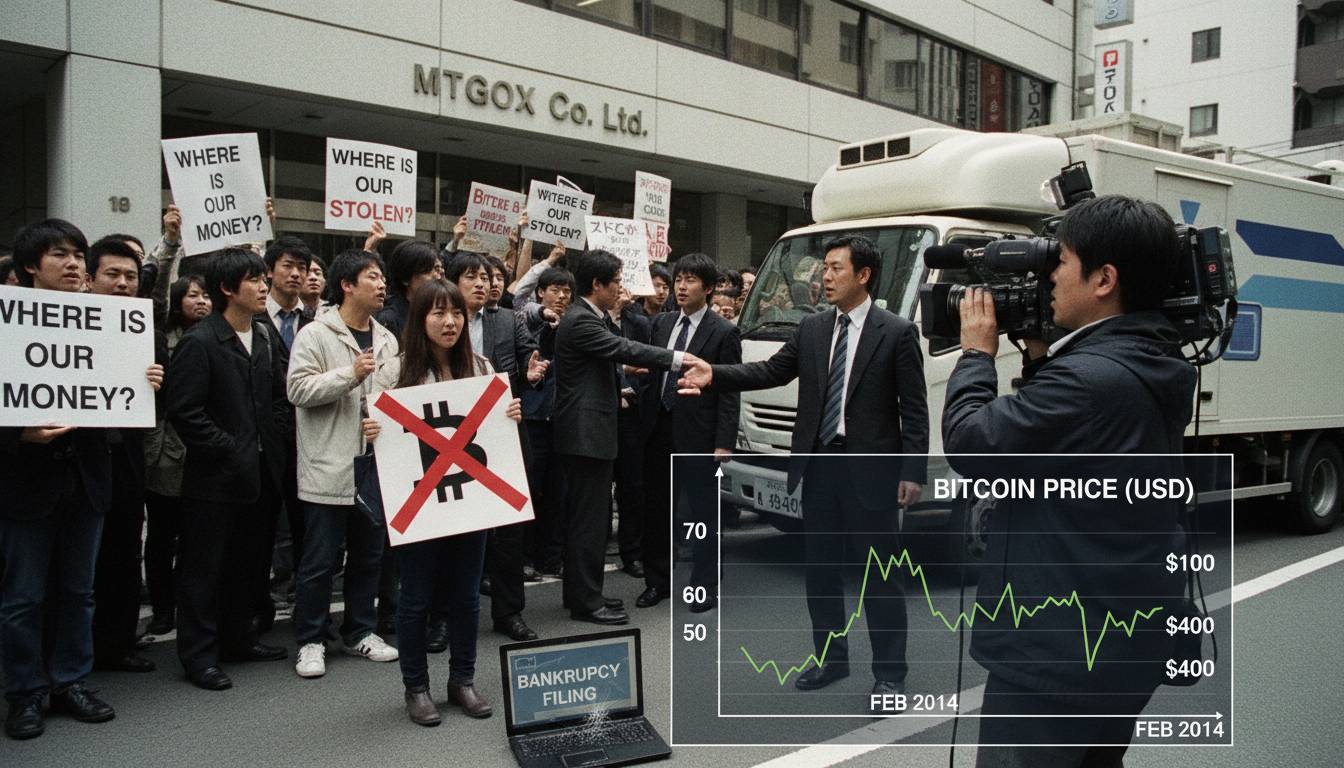
The 2013-2014 crash offers the earliest comparable cycle. After hitting around $1,100 in late 2013, Bitcoin collapsed roughly 85% over the next two years, bottoming near $200 in early 2015. The recovery to new all-time highs took approximately three years — Bitcoin didn’t surpass $1,100 again until late 2016/early 2017.
The 2017-2018 cycle followed a similar but compressed pattern. The December 2017 peak of nearly $20,000 gave way to an 84% drawdown that found its bottom around $3,200 in December 2018. From that bottom, Bitcoin took roughly three years to reach new highs, breaking $20,000 again in late 2020/early 2021.
The March 2020 COVID crash was different — a black swan event that caused a 50%+ drop in hours, bottoming around $3,800. The recovery was startlingly fast: Bitcoin reached new all-time highs within five months. This cycle proved that external shocks recover faster than internal bubbles, a distinction that matters for current analysis.
The 2022 bear market saw Bitcoin fall from its November 2021 high of $69,000 to a cycle bottom around $15,500 in late 2022 — roughly a 77% drawdown. As of early 2025, Bitcoin has already surpassed its previous cycle highs, reaching new all-time highs above $100,000.
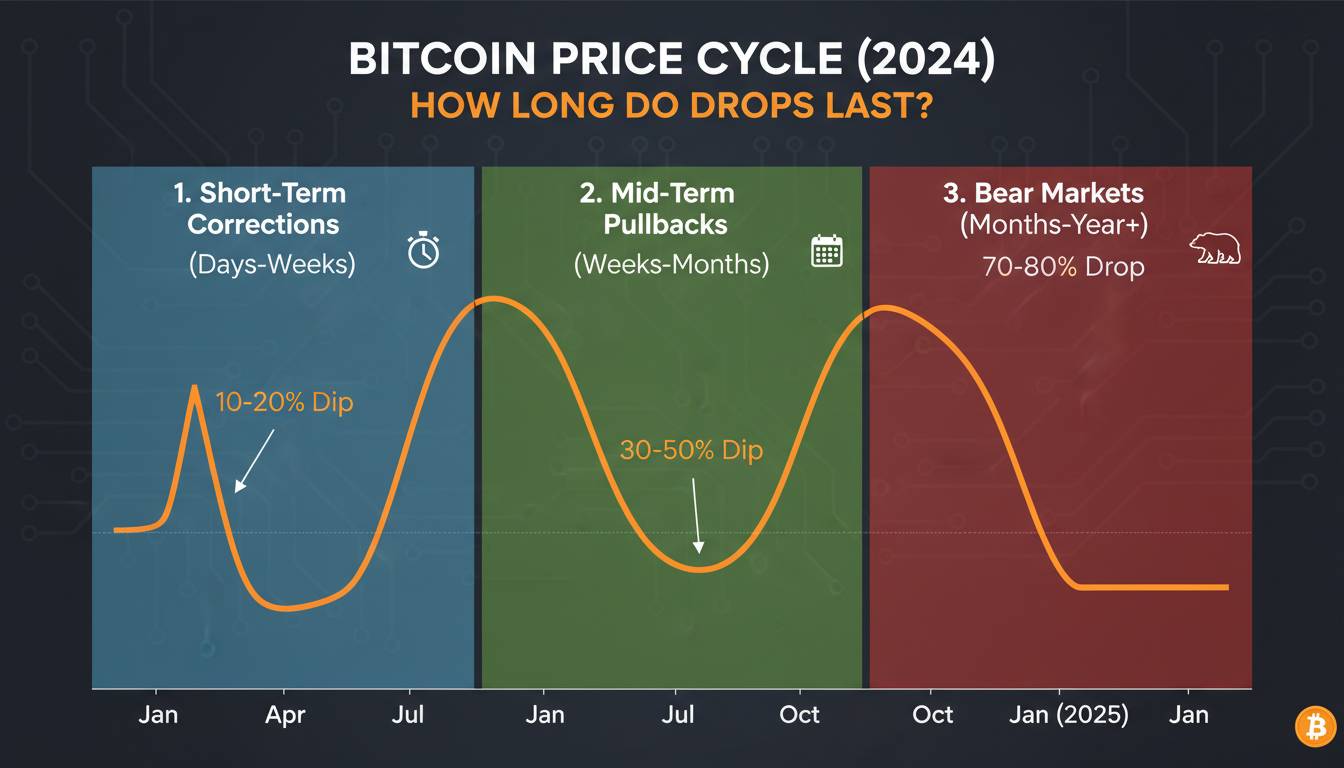
The pattern is clear: Bitcoin has never failed to reach a new nominal high after any crash in its fifteen-year history. The question is whether you’re willing to hold through the recovery period, which historically ranges from five months to three years depending on the crash type.
The Metrics That Actually Signal a Bottom
On-chain analysis gives us tools to measure investor behavior at the network level. These aren’t perfect predictors, but they offer a more grounded view than sentiment surveys or price charts alone.
MVRV Ratio: The Classic Bottom Signal
The MVRV ratio compares Bitcoin’s market capitalization to its realized capitalization — essentially measuring whether the average investor is holding at a profit or a loss. When market value falls significantly below realized value, historically that has preceded recoveries.
In the 2018 crash, MVRV dropped to approximately 0.7 at the bottom — meaning the market was valuing Bitcoin at 70% of what holders paid. The same territory was touched during the 2022 bottom. Historically, readings below 1.0 have coincided with capitulation phases and subsequent recovery periods.
The current MVRV reading as of early 2025 sits well above those bottom levels, which makes sense given we’ve already broken to new highs. But tracking this metric during future corrections will give you a sense of whether you’ve entered capitulation territory.
SOPR: Spent Output Profit Ratio
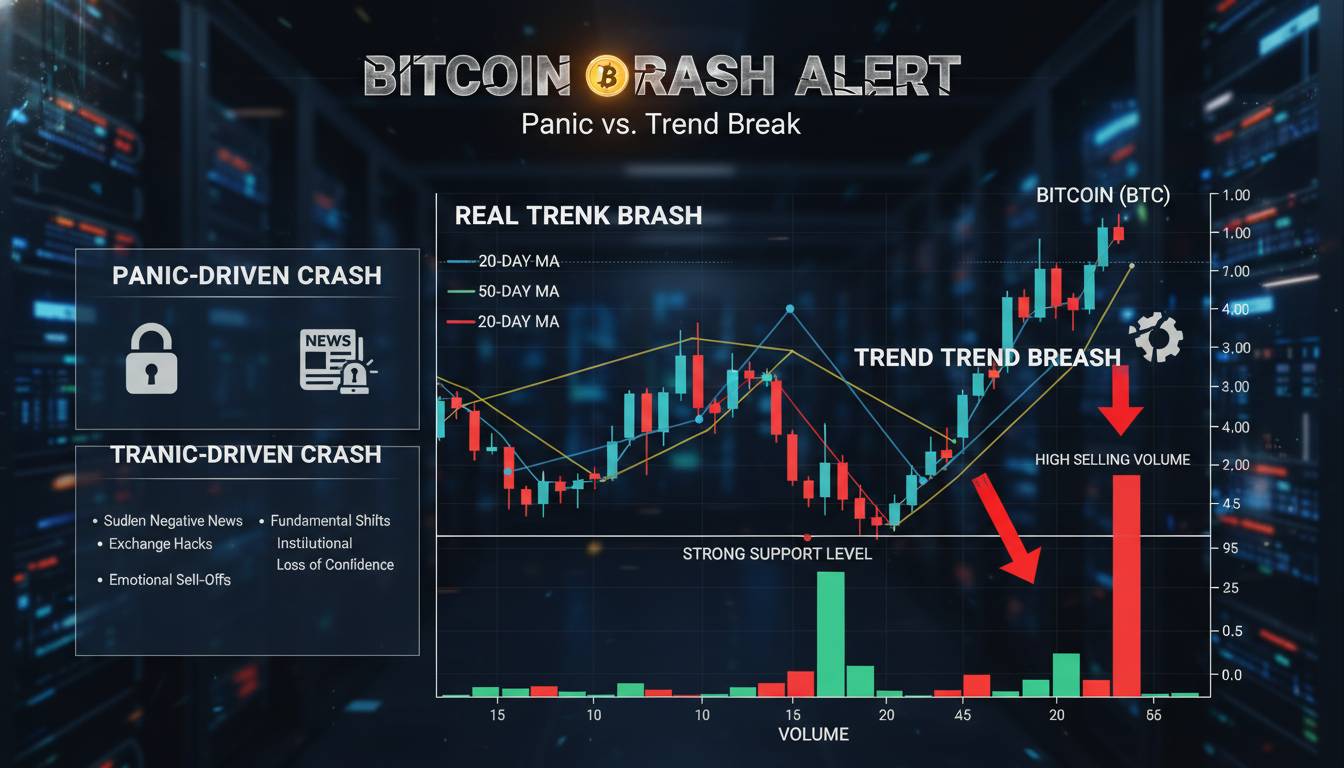
SOPR measures whether coins being spent are moving at a profit or loss. When SOPR consistently stays below 1.0, it means holders are spending coins at a loss — a sign of capitulation. In December 2018, SOPR dipped below 0.9 for an extended period. The March 2020 bottom saw similar behavior.
During the 2022 bottom, SOPR again spent considerable time below 1.0, particularly during the FTX collapse in November 2022. The metric has since recovered above 1.0, indicating profitability has returned to the broader market.
SOPR works best as a confirmation signal rather than a standalone predictor. You want to see sustained periods below 1.0 during a crash, followed by a return above 1.0 as the market stabilizes.
Exchange Reserves: Where the Bitcoin Are Moving
Exchange reserves track how much Bitcoin is held on cryptocurrency exchanges. When reserves drop significantly, it suggests holders are withdrawing coins to cold storage — a sign of accumulation and reduced selling pressure.
During the 2022 bear market, exchange reserves declined consistently from peak levels, even as prices fell. This divergence — falling prices with falling exchange balances — was interpreted by many analysts as smart money accumulating. By late 2022, exchange reserves had dropped to levels not seen since 2018.
As of early 2025, exchange reserves remain relatively low compared to previous cycles, suggesting sustained accumulation from long-term holders. This is generally constructive for price, but it’s important to remember that low reserves don’t guarantee immediate price appreciation — they simply indicate reduced selling pressure.
Reserve Risk: Long-Term Holder Conviction
Reserve Risk measures the ratio of current price to the revenue earned by long-term holders. When long-term holders have accumulated significantly but the price hasn’t reflected that accumulation, Reserve Risk hits historically low levels — signaling potential value.
During the 2018 and 2022 bottoms, Reserve Risk reached historically low readings. This metric is particularly useful because it captures the behavior of the most experienced, least reactive segment of the market. When long-term holders are accumulating but price hasn’t moved, the risk-reward proposition improves dramatically.
Here’s what trips up most people: these metrics are most obvious in hindsight. Identifying a bottom in real-time is genuinely difficult because the same readings can persist for months during extended drawdowns. MVRV below 1.0 in 2018 didn’t immediately trigger a rally — the market continued declining for another twelve months after that signal appeared.
What the Current On-Chain Landscape Shows
Looking at the current market as of early 2025, we’re in uncharted territory in some respects. Bitcoin has already surpassed its previous all-time high from the 2021 cycle. The on-chain metrics reflect a market that has largely digested the accumulation phase.
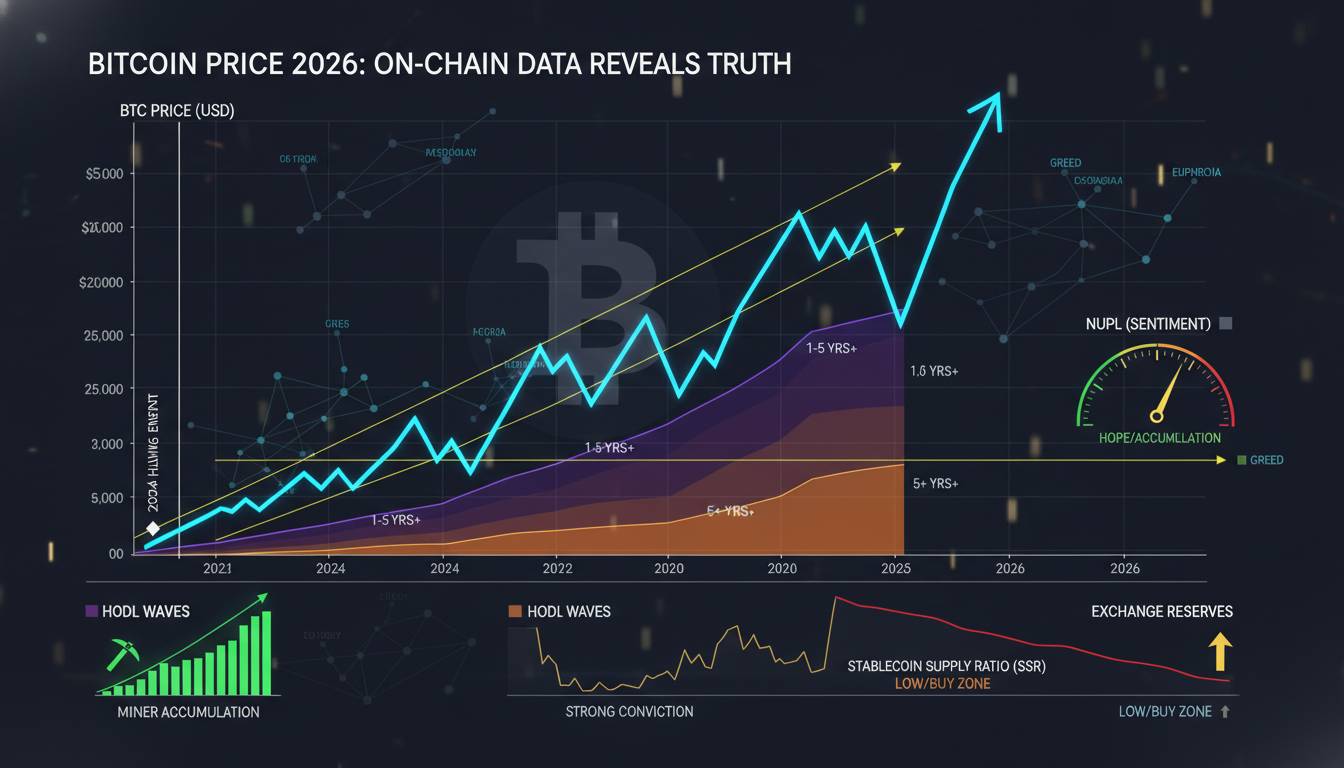
Long-term holder supply continues increasing. The number of coins held by addresses with at least a one-year holding period keeps climbing, a pattern consistent with healthy accumulation phases. HODL wave data shows that roughly 60-65% of Bitcoin supply hasn’t moved in over a year — similar to previous cycle peaks but with important differences in distribution.
The realized cap — the aggregate cost basis of all Bitcoin holders — has reached new highs alongside price. This is notable because it means the average investor is now in profit at current prices, which historically has been sustainable during bull markets but creates vulnerability during corrections.
Exchange balances remain relatively low, continuing the pattern established during the 2022 bear market. This suggests the supply-demand equilibrium continues to favor holders rather than sellers.
Here’s what the data doesn’t tell us: it doesn’t predict when the next correction will happen, how deep it will be, or whether we’re entering a multi-year consolidation period or continuing directly higher. The on-chain metrics are backward-looking measures of behavior that have preceded recoveries in the past — not crystal balls.
The Counterintuitive Truths Nobody Discusses
Let me push back on some conventional wisdom that dominates Bitcoin analysis.
First, past performance genuinely doesn’t guarantee future results in the way people assume. Yes, Bitcoin has recovered from every crash. But it has done so while becoming progressively more institutional, more regulated, and more integrated with traditional finance. The forces that drove 100x returns in early cycles may not replicate. I’m not saying Bitcoin won’t go higher — I’m saying assuming linear extrapolation from historical cycles is risky.
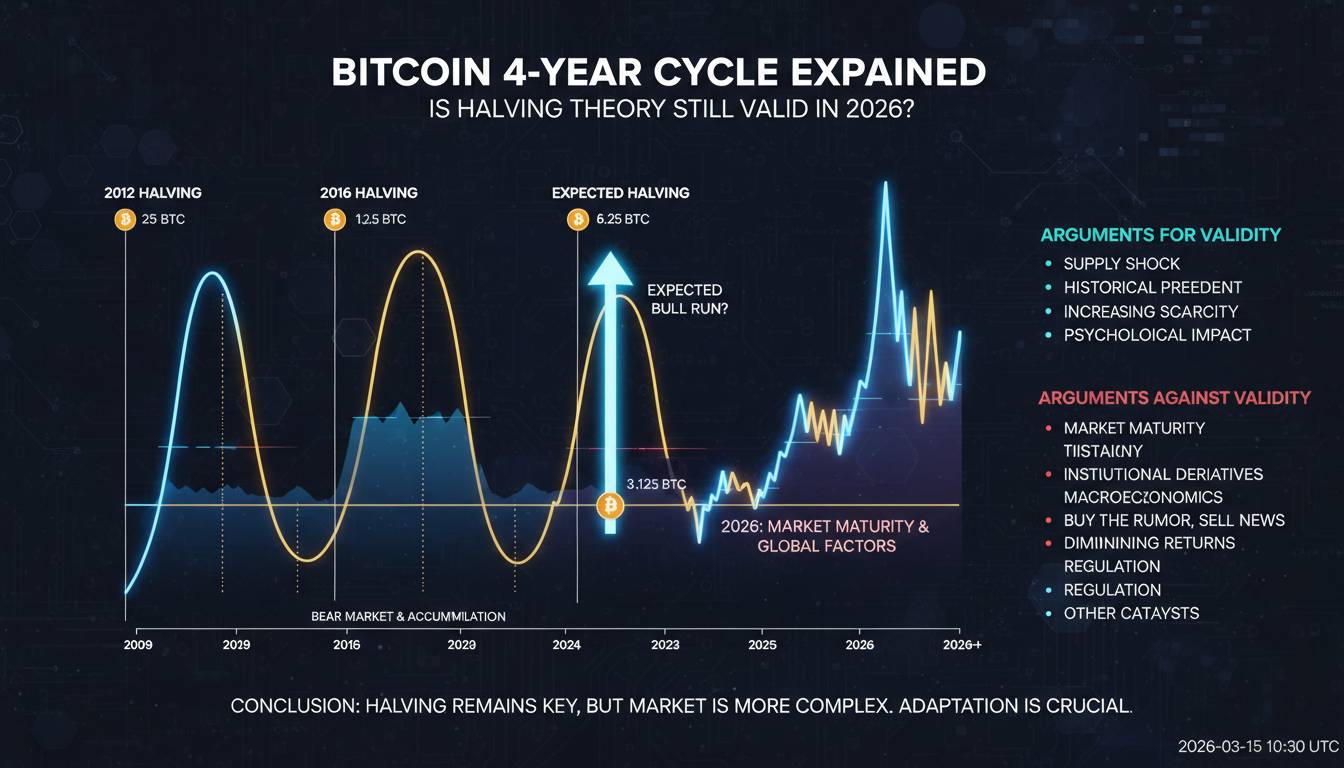
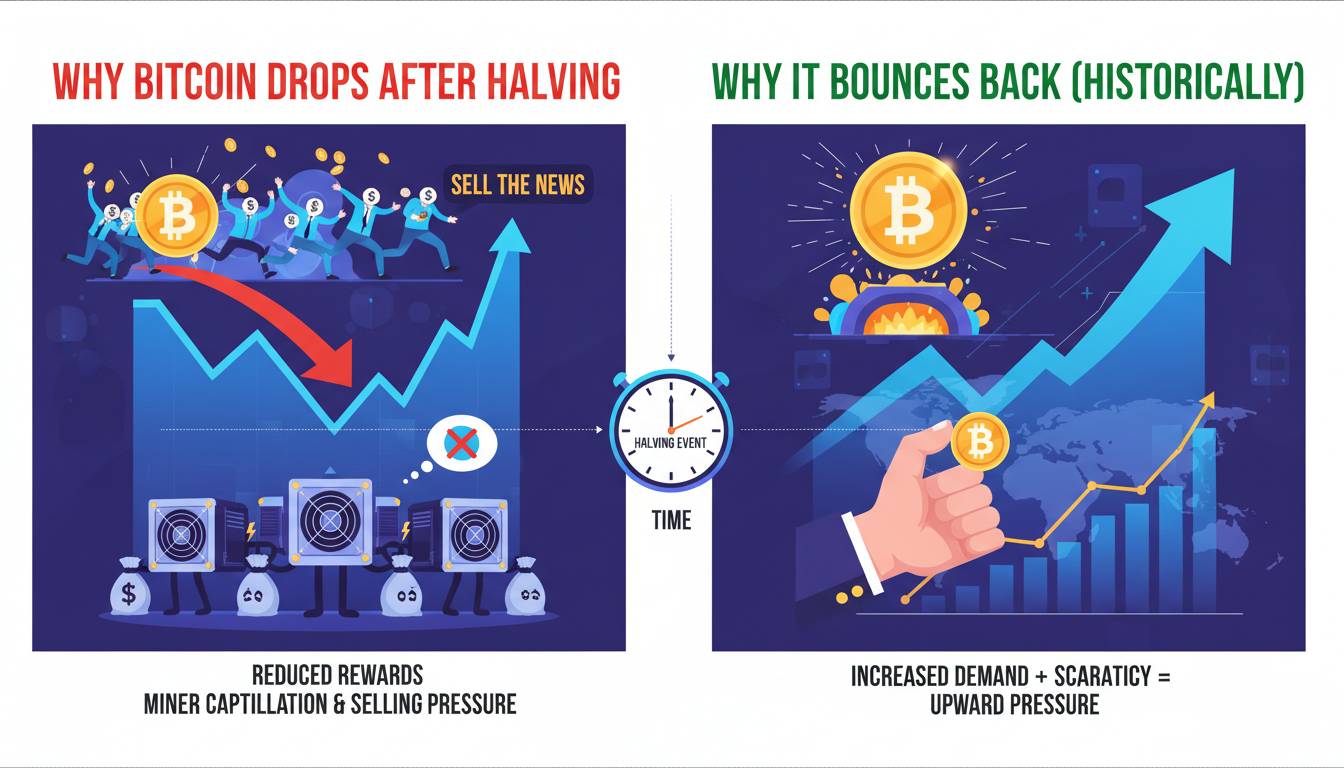
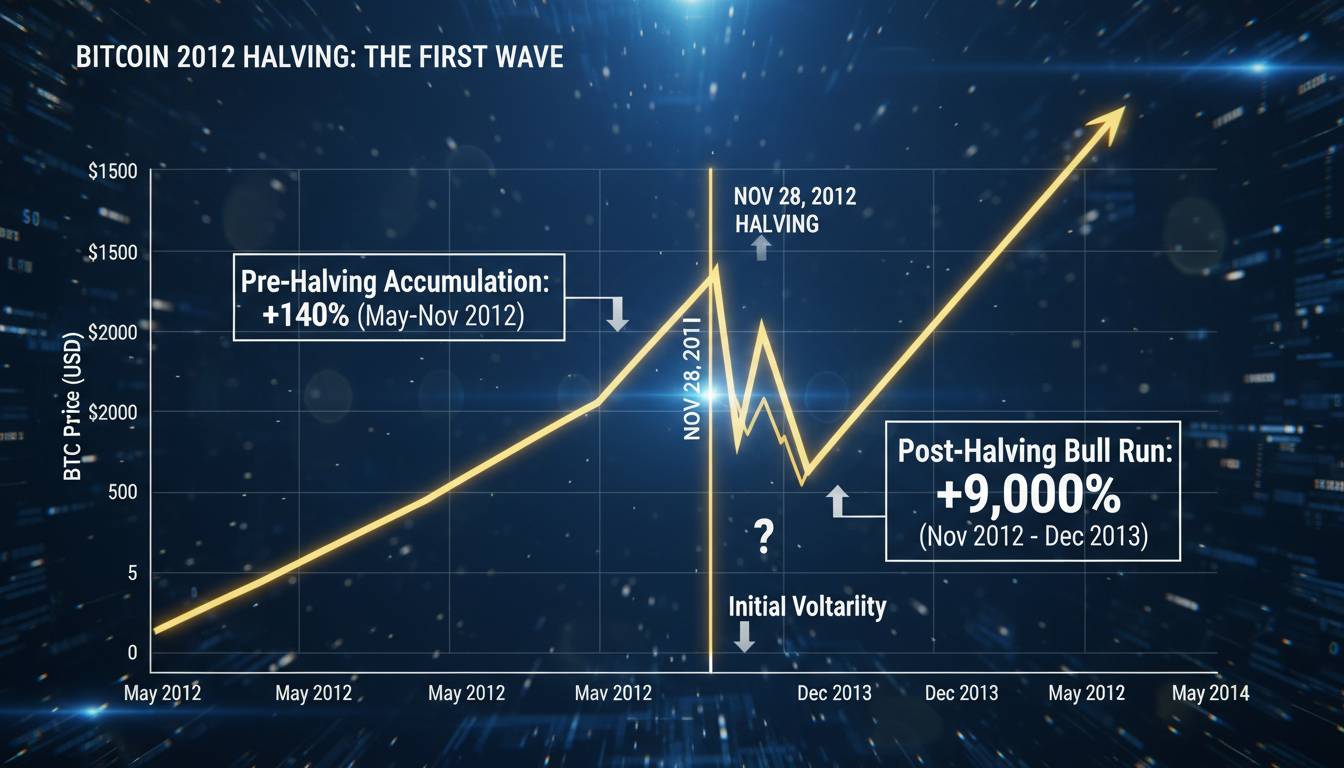
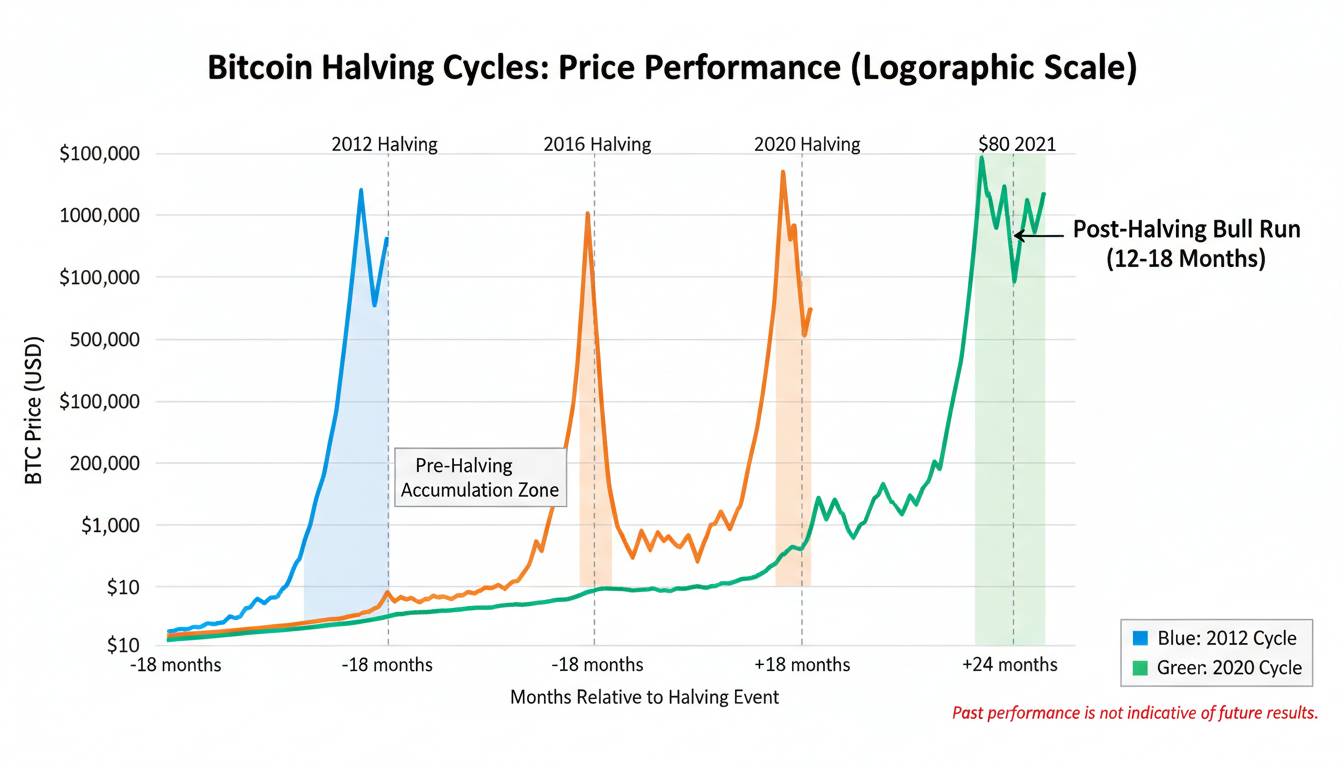
Second, the “Bitcoin halves” narrative is weaker than most analysts admit. The 2020 halving preceded a massive bull run, but so did the 2016 halving, while the 2012 halving preceded a shorter cycle. Post-halving rallies have been inconsistent in timing and magnitude. The supply reduction is real, but it’s been priced in for years in advance. This isn’t to dismiss the halving’s impact — it’s to say that treating it as a guaranteed catalyst is exactly the kind of pattern-matching that fails in markets.
Third, on-chain metrics are most reliable at extremes — they tell you when conditions are likely favorable for long-term entry, but they tell you almost nothing about timing. You could have bought profitably at MVRV readings below 1.0 in 2018, 2020, or 2022, but those opportunities existed for months before the actual bottom. The metric identifies favorable conditions, not specific entry points.
Fourth, and this is the hardest truth: the investors who do best in Bitcoin are the ones who stop checking charts. Not because the data doesn’t matter, but because trying to time corrections leads to selling at precisely the wrong moment. The data supports holding through cycles — not trading within them.
FAQ: On-Chain Data and Bitcoin Recovery
How long did Bitcoin take to recover after the 2018 crash?
Approximately three years. Bitcoin bottomed in December 2018 at around $3,200 and didn’t break above $20,000 (its previous all-time high) until late 2020. However, significant recovery occurred well before new highs — Bitcoin reached $10,000 by May 2019, roughly ten months after the bottom.
What MVRV ratio signals a Bitcoin bottom?
Historically, MVRV readings below 1.0 have coincided with major bottoms. The 2018 bottom saw MVRV around 0.7, the 2020 COVID crash briefly touched similar levels, and the 2022 bottom also reached approximately 0.7. However, these readings can persist for months, so they’re better used as confirmation of favorable conditions than as precise timing signals.
Will Bitcoin reach new all-time highs again?
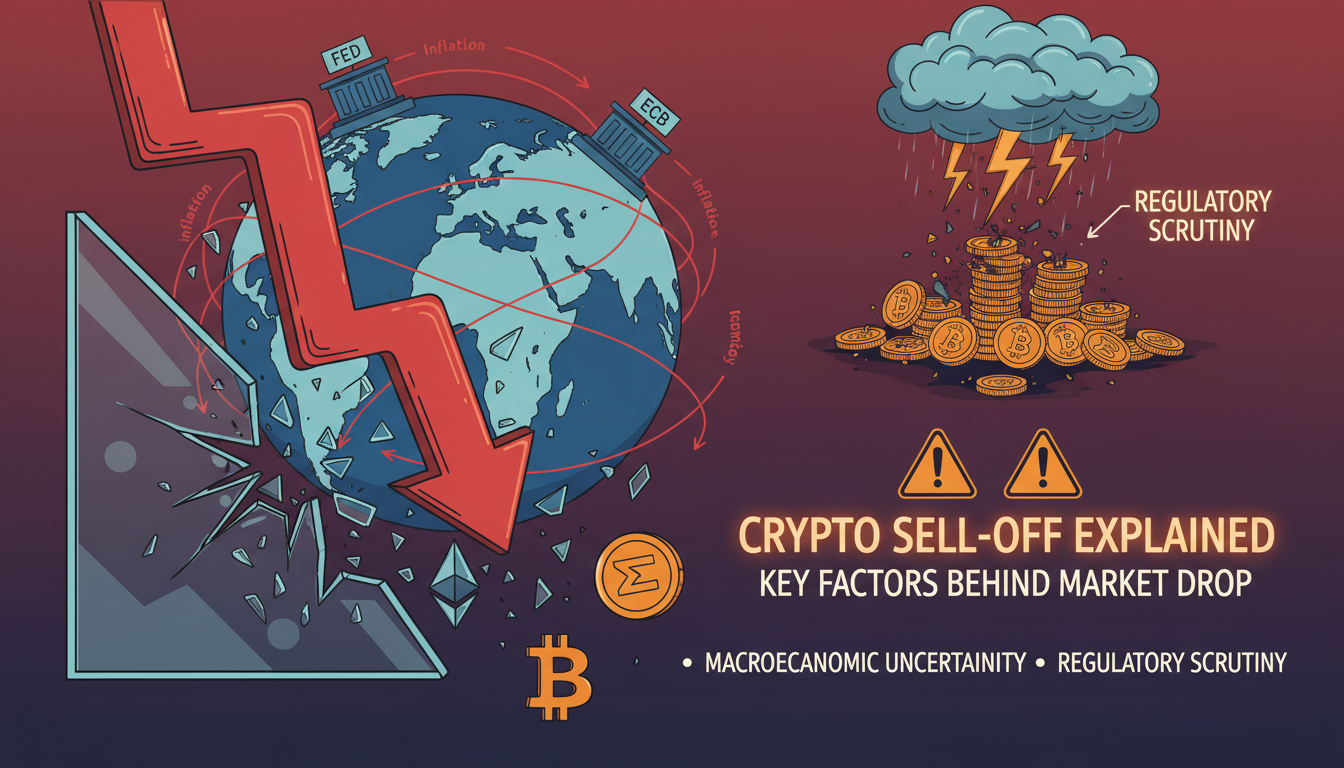
Based on historical patterns, Bitcoin has always reached new nominal highs after every major crash. As of early 2025, Bitcoin has already surpassed its previous $69,000 high from the 2021 cycle. Whether it continues higher depends on factors beyond on-chain metrics, including macroeconomic conditions, regulatory developments, and broader adoption.
What happened to Bitcoin after the 2022 crash?
Bitcoin bottomed around $15,500 in late 2022 and began recovering throughout 2023. By early 2024, Bitcoin had surpassed $50,000, and by late 2024/early 2025, it reached new all-time highs above $100,000. The recovery was faster than many expected, demonstrating how quickly capitulation can transition to new bull phases.
The Honest Assessment
Here’s where I need to be direct: I cannot tell you whether Bitcoin will go back up from any specific price point. No credible analyst can. What the on-chain data does show is that historically, conditions favorable for long-term entry have coincided with specific metric readings — and those conditions have consistently preceded eventual recoveries.
If you’re looking for certainty from on-chain analysis, you’ll be disappointed. The metrics work best as guides for thinking about risk and opportunity, not as prediction engines. They’re most useful for answering questions like: “Is the market in a period of capitulation?” or “Are long-term holders accumulating or distributing?” — not “What will the price be in six months?”
The pattern across every major crash in Bitcoin’s history is consistent: dramatic declines, extended recovery periods, and eventual new highs. The on-chain data during those crashes shows capitulation, accumulation by sophisticated holders, and reduced exchange balances. These patterns have repeated — but they don’t guarantee future outcomes.
What I can say with confidence: Bitcoin has never failed to reach a new nominal high after any crash in its history. Whether that pattern continues depends on factors well beyond what the blockchain can measure. The data supports a long-term optimistic view — but so would noting that Bitcoin has existed for fifteen years and has gone from $0 to over $100,000. The on-chain metrics add nuance to that story; they don’t create it.
The question isn’t really “will Bitcoin go back up” — history answers that. The better question is whether you’re willing to hold through the volatility that precedes every recovery. The data suggests that strategy has worked. It doesn’t guarantee it will work again — but nothing in markets ever does.